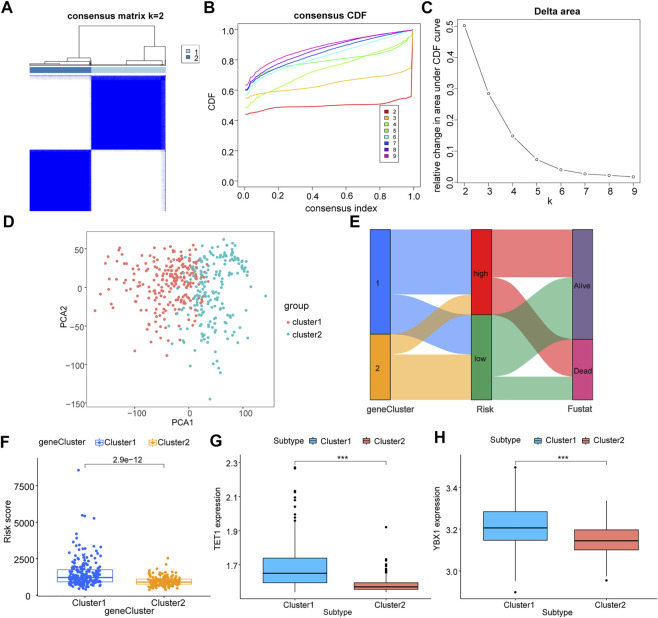
FIGURE 4.
Correlation analysis of m5C regulator genes with molecular subtypes of TCGA liver cancer. All samples of TCGA were clustered according to their expression level of m5C regulator genes; (A): sample size after grouping; (B): change in area under the CDF curve (k = 2–9); (C): change of delta area plot when k = 2 to k = 9; D: PCA analysis of cluster1 and cluster2, where cluster 1 is in red and cluster 2 is in blue; (E): Sankey diagram combining survival status and LASSO model grouping; (F): difference in risk scores of different groupings, cluster 1 in blue and cluster 2 in orange; (G,H): differential expression of key m5C regulator genes TET1 (G) and YBX1 (H) in different groupings, cluster 1 in blue and cluster 2 in red.

