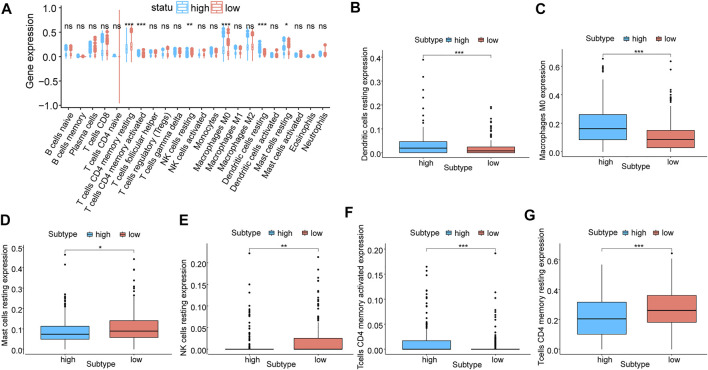
FIGURE 6.
Correlation analysis of prognostic models and immune cells. (A) Differential analysis of the degree of immune cell infiltration in prognostic model subgroups, blue for high-risk and red for low-risk; (B–G): Differential analysis of the degree of infiltration of six types of immune cells, including resting dendritic cells, M0 Macrophages, resting mast cells, resting NK cells, activated CD4 T cells, and resting CD4 T cells.

