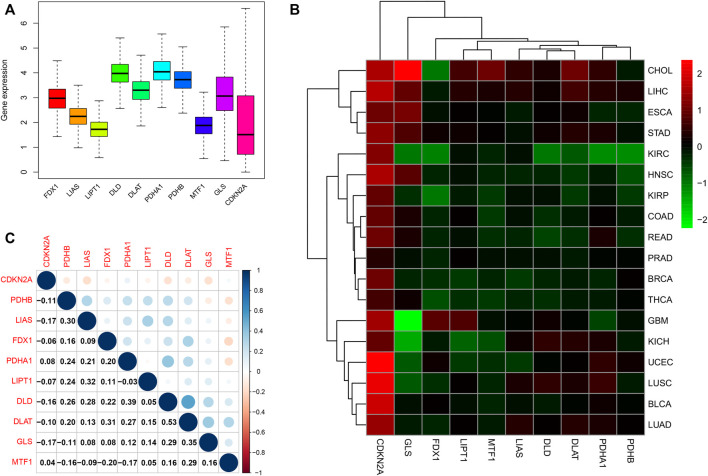
FIGURE 2.
Differential expression and correlation analysis of 10 cuproptosis-associated genes in various cancer types. (A) Different levels of cuproptosis-associated genes in 33 cancers. Different colors in the bar chart represent different genes. The Y-axis in boxplot means the relative gene expression level in pan-cancer. (B) The differential expression of cuproptosis-associated genes in 18 cancers. The red boxes indicate high expression, and the green boxes indicate low expression. (C) Correlation analysis of cuproptosis-associated genes. Blue and red dots indicate positive and negative correlations, respectively.

