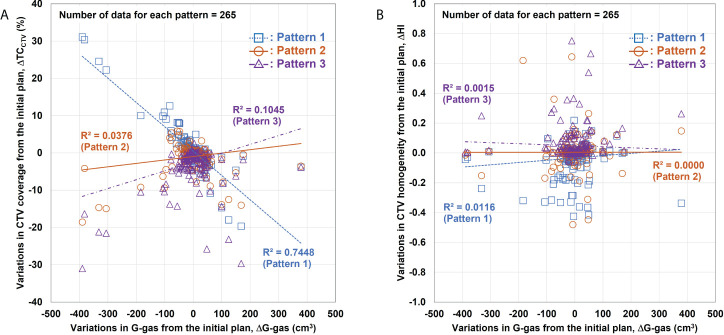
Figure 5.
Relationship between variations in the gastrointestinal gas (ΔG-gas) volume and the variations in the clinical target volume (CTV) coverage (ΔTCCTV) and homogeneity index (ΔHI). (A) Relationship between ΔG-gas and ΔTCCTV (V95%); (B) ΔHI. The horizontal axis shows the volume variation in G-gas from the initial plan. The effect of the beam range is considered in ΔG-gas. The vertical axes in (A) and (B) show the variations in TCCTV and HI from the initial plan, respectively. The smaller the gradient, the smaller the effect of G-gas.

