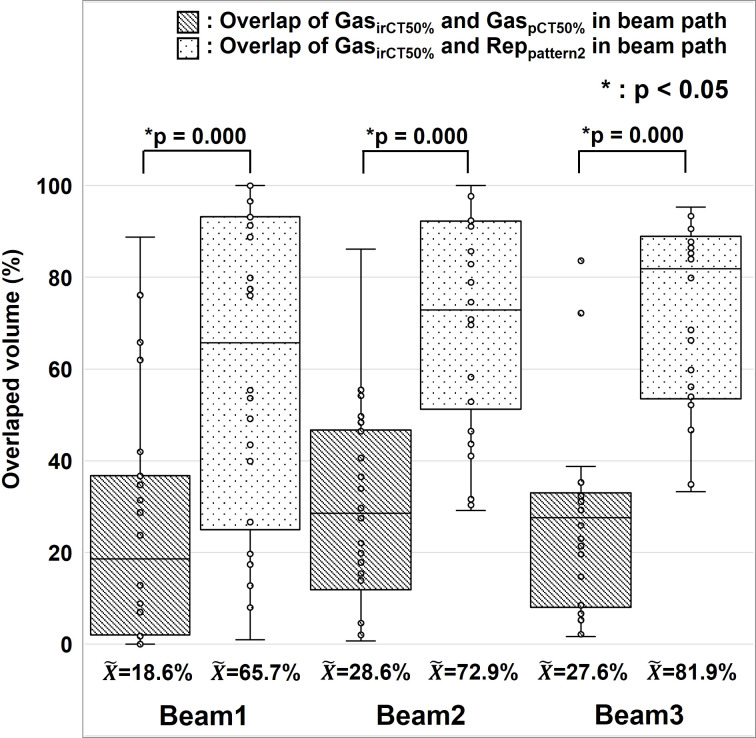
Figure 6.
Positional changes of gastrointestinal gas. The median, first and third quartile, maximum and minimum values, and outliers for the concordance of gas contouring is presented in a box-and-whisker plot per each beam. The gas contour of the treatment planning CT images is presented as GaspCT50% , the gas contour in the in-room CT images is presented as GasirCT50% , and the replacement region set using Pattern 2 during treatment planning is presented as Reppattern2. We used the Wilcoxon signed rank test for the statistical analysis. The symbol * indicate that there is a significant difference between them.

