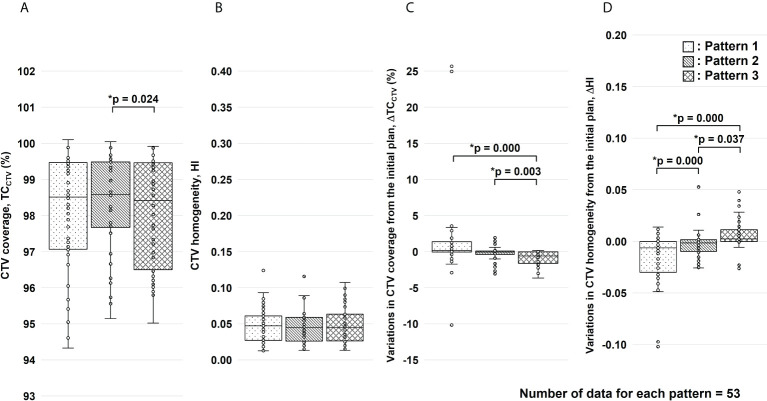
Figure 7.
Results of the clinical target volume (CTV) coverage (TCCTV) and homogeneity index (HI) evaluation for the total dose. Figure panels (A, B) show the results of TCCTV and HI, respectively. Figure panels (C, D) show the results of variations in TCCTV (ΔTCCTV) and HI (ΔHI) from the initial plan, respectively. These results were corrected for changes in factors other than gastrointestinal gas. For each replacement pattern, the median, first and third quartiles, maximum and minimum values, and outliers for (A) TCCTV, (B) HI, (C) ΔTCCTV, and (D) ΔHI are presented in a box-and-whisker plot. Statistical analyses were performed using the Friedman test. The symbol * indicate that there is a significant difference between them.

