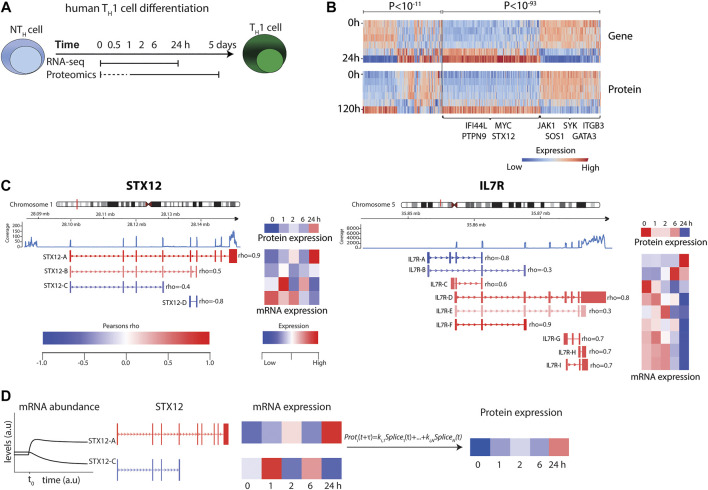
FIGURE 1.
RNA-seq and mass-spectrometry analysis of TH1 differentiation revealed highly variable correlations. (A) Experimental design. (B) Heat map of transcript and protein abundance dynamics in genes that show significant negative (left) and positive (right) correlations. Genes of particular relevance for T cells and T cell differentiation are highlighted in the figure. (C) Examples of transcript splice variants showing that both STX12 (left) and IL7R (right) were significantly negatively and positively correlated with protein levels. (D) Illustration of the modelling procedure for resolving the poor correlation, using STX12 as an example.

