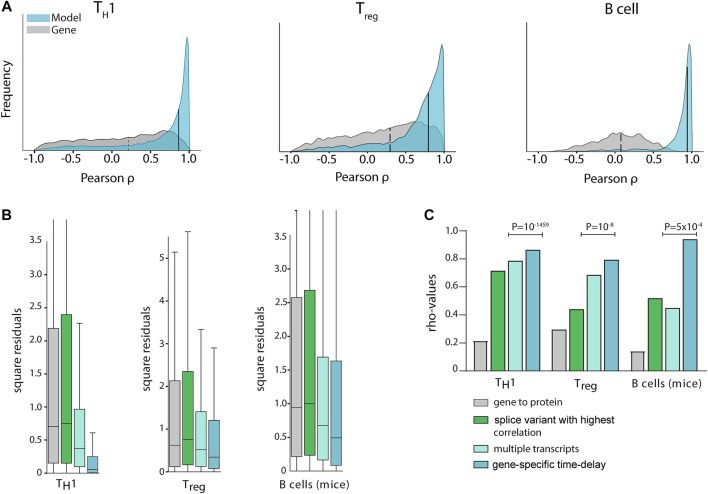
FIGURE 2.
Multiple transcripts and time delays increased mRNA and protein correlations significantly in multiple cell types. (A) Gene/protein Pearson correlations in TH1 (left), Treg (middle), and murine B-cell (right) differentiation. In the histogram, the grey curve shows the correlation distribution when the sum of all splice variant expressions of a transcript (Fortelny et al., 2017) is used to quantify mRNA abundance (median: dashed line), while in the blue histogram our time delayed multiple splice variant based models are used (medians: solid lines at 0.86, 0.79, and 0.94 for TH1, Treg and murine B-cells, respectively). Only cross-validated protein predictions are shown for the proteins for which the null-model could be rejected. (B) Out-of-sample cross validation prediction of the three models. Aiming to quantify the predictive power of each added input to the model, we observed that a linear model with gene-specific time delays was the model that generated predictions with the smallest sum of squared residuals. (C) Median correlation coefficients (rho) for different mathematical protein prediction models derived from mRNA with increasing protein abundance correlations. P-values were derived from predictions using leave-one-out cross-validation.

