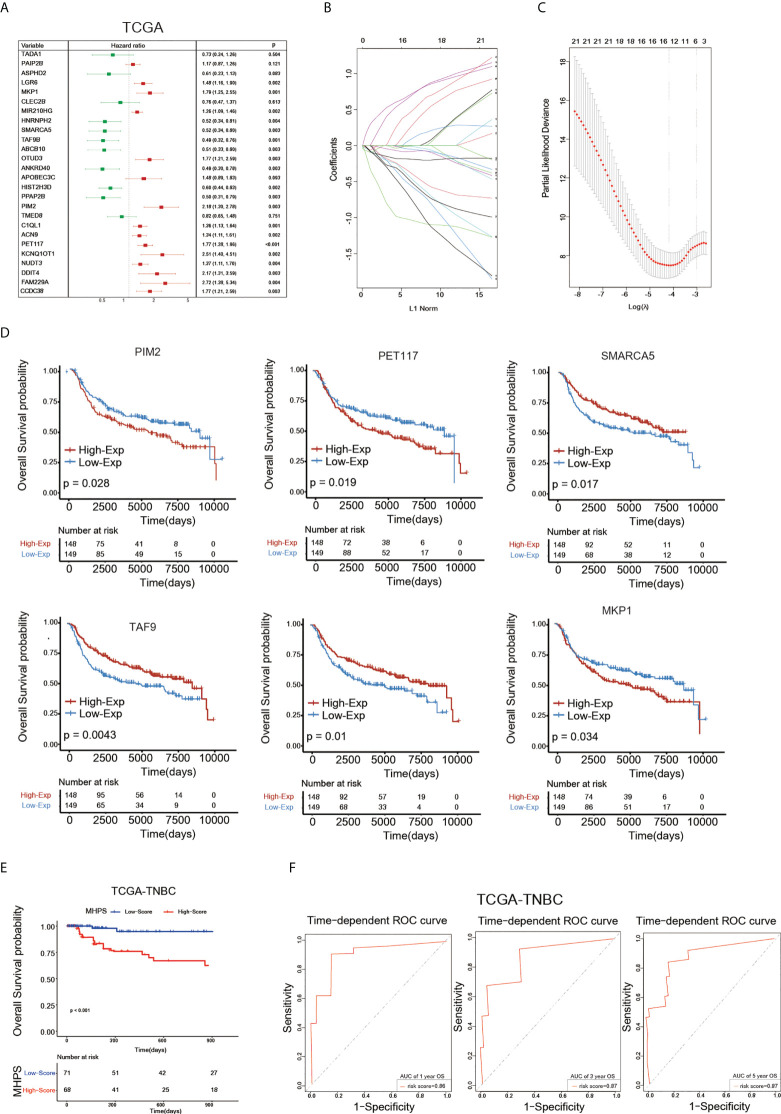
Figure 6.
Construction of m6A-hypoxia signature(MHPS). (A)The Forest plot of Univariate Cox regression analysis of 26 m6A-hypoxia genes. (B, C) LASSO-Cox regression analysis and partial likelihood deviance of prognostic m6A-hypoxia genes. (D) The K-M analysis of 6 candidates gene consisting of signature. (E) The K-M analysis of overall survival (OS) between the high- and low-risk groups in TCGA-TNBC. (F) ROC curve analysis of MHPS in TNBC cohorts.

