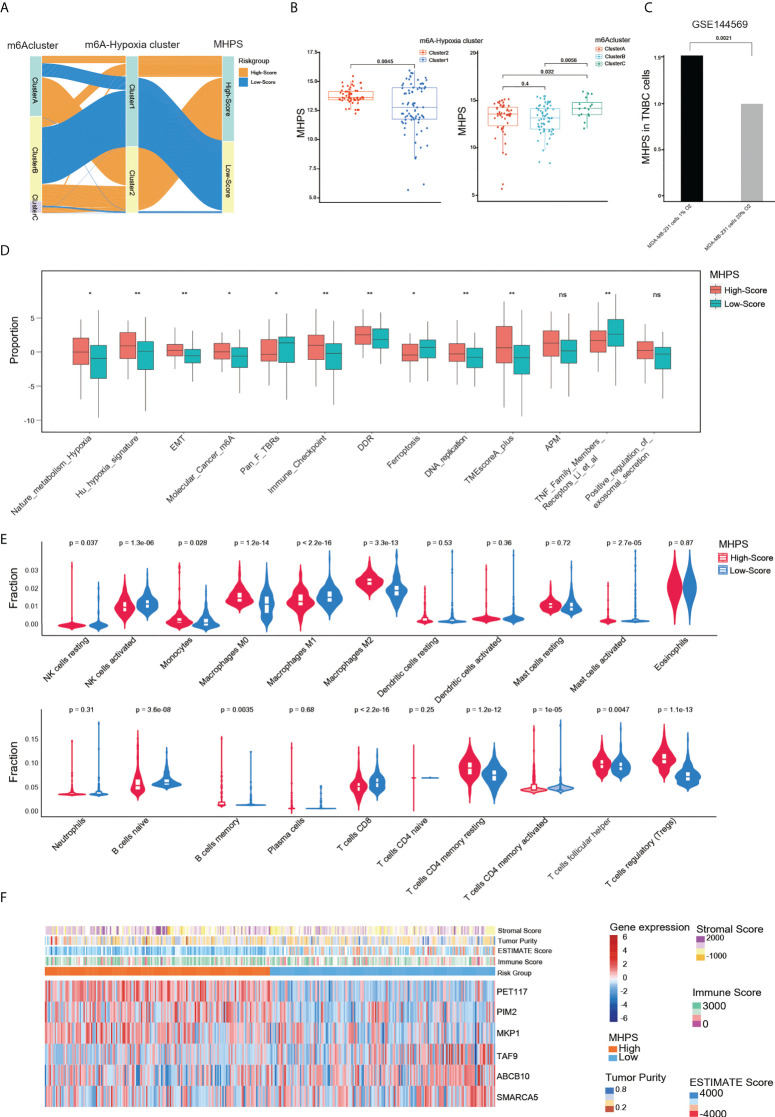
Figure 7.
Evaluation of the clinical features of MHPS in TNBC. (A) Alluvial diagram of subgroup distributions in groups with different MHPS score, m6A clusters and m6A-hypoxia cluster. (B) Comparison of MHPS scores in 2 m6A-hypoxia and 3 m6A clusters. (C) Comparison of MHPS scores in MDA-MB-231 cell lines cultured under normoxia and hypoxia. (D) TME and hypoxia signatures score in high and low MHPS group. (E) Immune cell infiltration in high and low MHPS group. (F) Heatmap of hub gene expression profile and immune score, ESTIMATE score, stromal score and tumor purity distribution in high and low MHPS group. (*P< 0.05 and **P< 0.01). ns, not significant.

