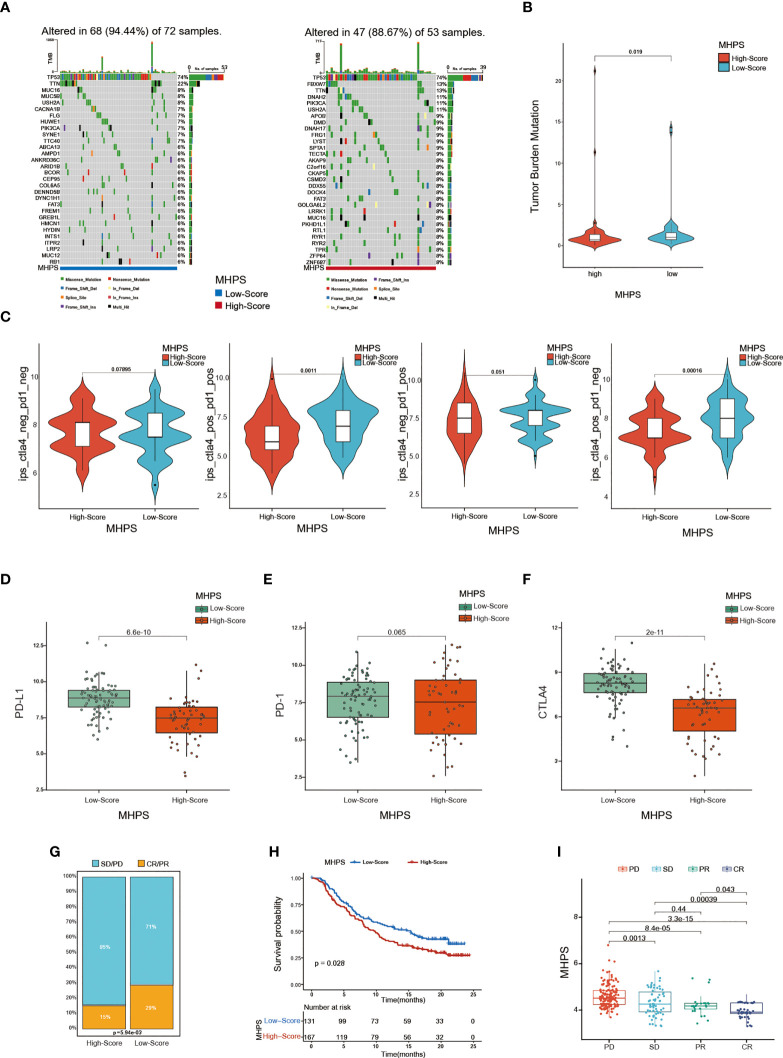
Figure 8.
Evaluation of the sensitivity to immunotherapy with MHPS (A) Oncoplot of gene mutations in the low- and high-risk groups. (B) The tumor burden of low- and high-risk groups. (C) Comparison of immunophenoscore (IPS) between low and high MHPS risk groups. (D–F) Expression of PD-1, PD-L1, CTLA-4 in low- and high-risk groups (G)Proportion of immunotherapy responsive and ineffective patients in low- and high-risk groups. SD, stable disease; PD, progressive disease; CR, complete response; PR, partial response. (H) Different overall survival of patients with high or low MHPS score. (I) Comparison of risk score of patients with different immunotherapy responses.

