Figure 9.
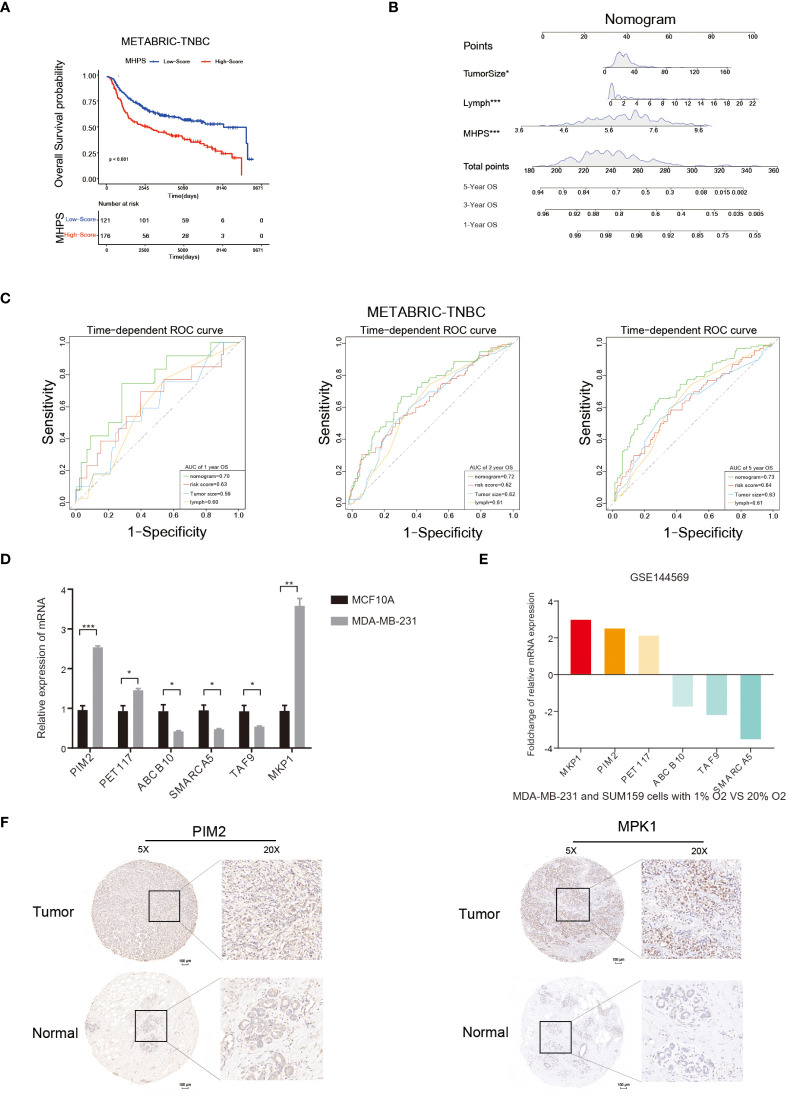
Nomogram and detection of MHPS gene expression. (A) Kaplan-Meier analysis of patients with high or low MHPS risk socre in METABRIC-TNBC cohort. (B) Construction of nomogram scoring system to predict patient survival at 1-, 3- and 5- years. Each clinical factor in the nomogram system corresponds to a score, and all scores are summed to obtain a total point, which can predict the survival rate of patients at 1-, 3- and 5- years. (C) Time-dependent ROC for the nomogram, MHPS, tumor size, lymph node in the METABRIC cohort (for predicting 1, 3, and 5-years OS). (D) Comparison of mRNA expression of hub genes in normal breast and TNBC cell lines. (E) Different expression of hub genes in normoxia and hypoxia cultured TNBC cells based on GSE144569 dataset. (F) IHC staining to detect protein expression of PIM2 and MKP1 in normal and tumor tissues. Scale bar:100μm.(*P< 0.05,**P< 0.01, and ***P< 0.001). ns, not significant.

