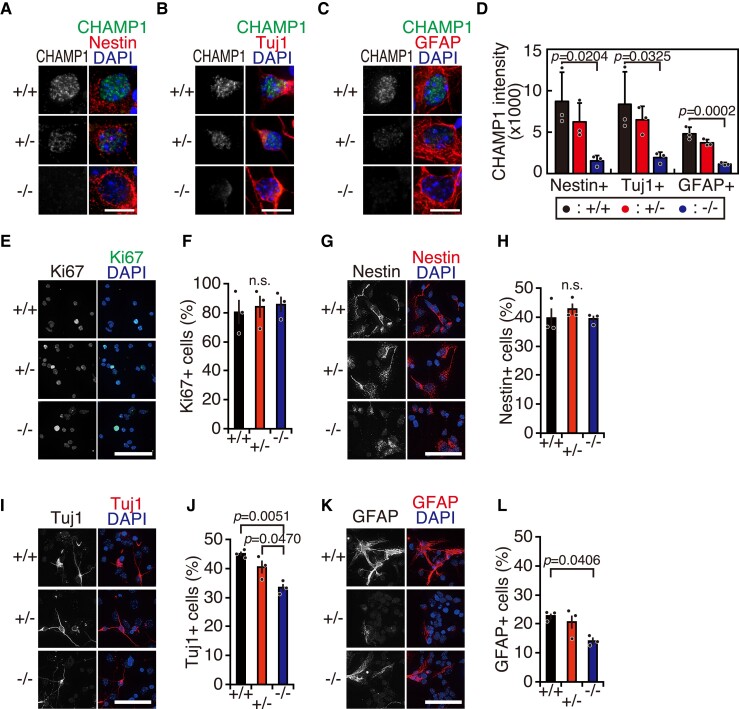
Figure 4.
CHAMP1 is involved in NSC differentiation and axon outgrowth. (A) Immunofluorescence staining of NSCs isolated from the cortex of E14.5 CHAMP1+/+ (upper), CHAMP1+/− (middle), and CHAMP1−/− (lower) mice using antibodies against CHAMP1 (green) and Nestin (red). Nuclei were stained with DAPI (blue). Scale bar: 10 μm. (B) Immunofluorescence staining of neurons differentiated from NSCs of E14.5 CHAMP1+/+ (upper), CHAMP1+/− (middle), and CHAMP1−/− (lower) mice in vitro using antibodies against CHAMP1 (green) and Tuj1 (red). Nuclei were stained with DAPI (blue). Scale bar: 10 μm. (C) Immunofluorescence staining of astrocytes differentiated from NSCs of E14.5 CHAMP1+/+ (upper), CHAMP1+/− (middle), and CHAMP1−/− (lower) mice in vitro using antibodies against CHAMP1 (green) and GFAP (red). Nuclei were stained with DAPI (blue). Scale bar: 10 μm. (D) Quantification of CHAMP1 signal intensity in cultured NSCs (Nestin+), neurons (Tuj1+), and astrocytes (GFAP) isolated from E14.5 CHAMP1+/+ (n = 3), CHAMP1+/− (n = 3), and CHAMP1−/− (n = 3) mice. The data represent a minimum of 40 cells per mouse. Error bars represent S.D. P values were determined by Tukey–Kramer test. (E) Immunofluorescence staining of NSCs isolated from the cortex of E14.5 CHAMP1+/+ (upper), CHAMP1+/− (middle), and CHAMP1−/− (lower) mice using antibodies against Ki67 (green). Nuclei were stained with DAPI (blue). Scale bar: 50 μm. (F) Quantification of Ki67-positive NSCs (CHAMP1+/+; n = 3, CHAMP1+/−; n = 3, CHAMP1−/−; n = 3). The data represent a minimum of 1000 cells per mouse. Error bars represent S.E.M. P values were determined by Tukey–Kramer test. n.s., not statistically significant. (G, I, K) Immunofluorescence staining of NSCs isolated from the cortex of E14.5 CHAMP1+/+ (upper), CHAMP1+/− (middle), and CHAMP1−/− (lower) mice differentiated in vitro by growth factor withdrawal using antibodies against Nestin (G), Tuj1 (I), or GFAP (K) (red). Nuclei were stained with DAPI (blue). Scale bar: 50 μm. (H, J, L) Quantification of differentiated NSCs positive for Nestin (H), Tuj1 (J), or GFAP (L) (CHAMP1+/+; n = 3, CHAMP1+/−; n = 3, CHAMP1−/−; n = 3). The data represent a minimum of 1004 cells per mouse. Error bars represent S.E.M. P values were determined by Tukey–Kramer test. n.s., not statistically significant.

