Figure 5.
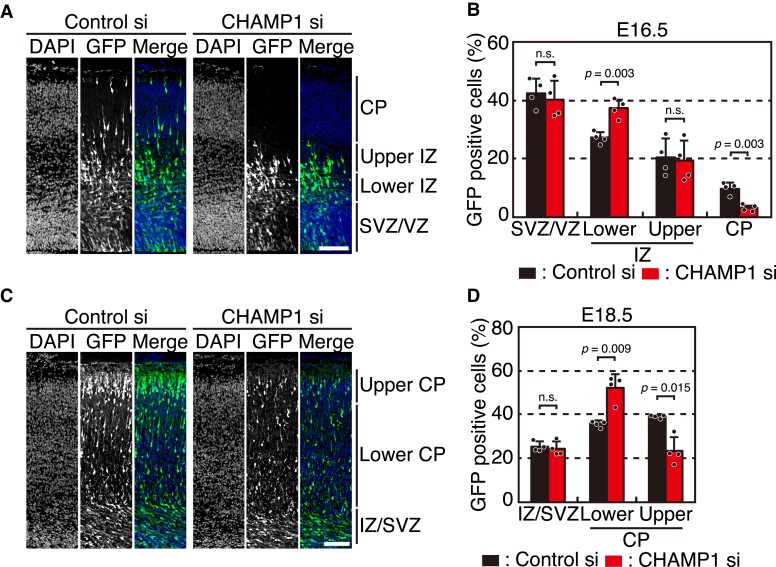
CHAMP1 knockdown leads to delayed cortical migration. (A) Cell localization in E16.5 mouse cortices electroporated with mock or CHAMP1 siRNA at E14.5. Electroporated cells expressing GFP were shown in green. Nuclei were stained with DAPI (blue). Scale bar: 50 μm. CP, cortical plate; IZ, intermediate zone; SVZ, sub-ventricular zone; VZ, ventricular zone. (B) Quantification of GFP-positive cells treated with control or CHAMP1 siRNA in each layer shown in (A) (n = 4). Error bars represent S.D. P values were determined by Student’s t-test. n.s., not statistically significant. (C) Neuronal migration in E18.5 mouse cortices electroporated with mock or CHAMP1 siRNA at E14.5. Electroporated cells expressing GFP were shown in green. Nuclei were stained with DAPI (blue). Scale bar: 50 μm. (D) Quantification of GFP-positive cells treated with control or CHAMP1 siRNA in each layer shown in (C) (n = 4). Error bars represent S.D. P values were determined by Student’s t-test. n.s., not statistically significant.

