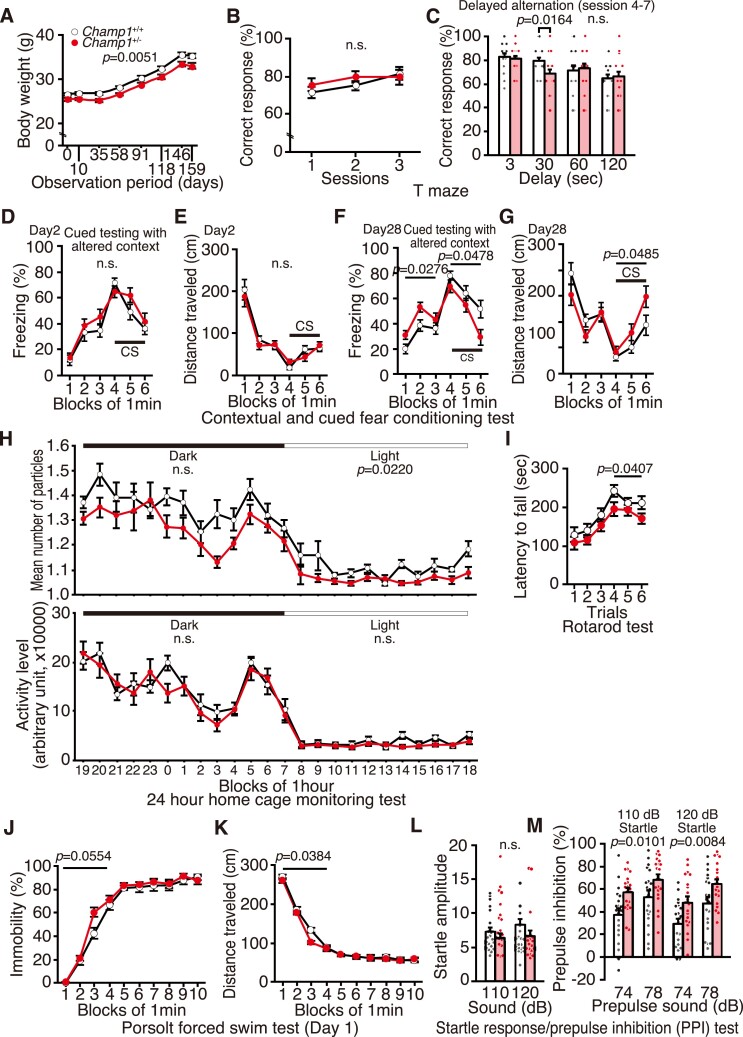
Figure 6.
CHAMP1+/− mice show mild memory defects, altered social interaction and depressive behaviours. (A) Body weight of CHAMP1+/+ (white circle; n = 20) and CHAMP1+/− (red circle; n = 20) mice during 10–37 weeks-old, plotted against observation period of the behavioural test battery. (B, C) T-maze forced alteration test. Percentage of correct response in the first three training (B) and the four consecutive sessions with various delay times (C) of CHAMP1+/+ (white bars) and CHAMP1+/− (red bars) mice. (D-G) Cued and contextual fear conditioning test: (D) percentage of freezing time and (E) total distance moved in the chamber on Day 2, and (F) percentage of freezing time and (G) total distance moved in the chamber after 1 month of CHAMP1+/+ (white circle) and CHAMP1+/− (red circle) mice. CS: conditioned stimulus. (H) Social interaction test in home cage: mean number of particles, which represents the contact between two mice (upper graph, one particle: two mice were together, two particles: they were separating), and mean activities (lower graph) of CHAMP1+/+ (white circle) and CHAMP1+/− (red circle) mice. (I) Latency to fall of CHAMP1+/+ (white circle) and CHAMP1+/− (red circle) mice in the rotarod test. (J, K) Porsolt forced swim test: (J) percentage of immobility and (K) total distance moved on Day 1 by CHAMP1+/+ (white circle) and CHAMP1+/− (red circle) mice. (L, M) Startle response and PPI test. Acoustic startle response to stimuli of 110 or 120 dB (L), and inhibition of the startle response by prepulse of 74 or 78 dB (M) in CHAMP1+/+ (white bars) and CHAMP1+/− (red bars) mice. For all graphs, twenty male mice of both genotypes were used, and error bars represent S.E.M. P values for genotype effects were determined by two-way repeated measurement ANOVA. In (C) at 30 s, Student’s t-test was used. In (F) and (G), data before CS (1–3 min) and during CS (4–6 min) were analyzed separately. In (I), data for the 1st to 3rd trials and the 4th to 6th trials were analyzed separately. In (L) and (M), data for early time points (1–4 min) and late time points (5–10 min) were analyzed separately.

