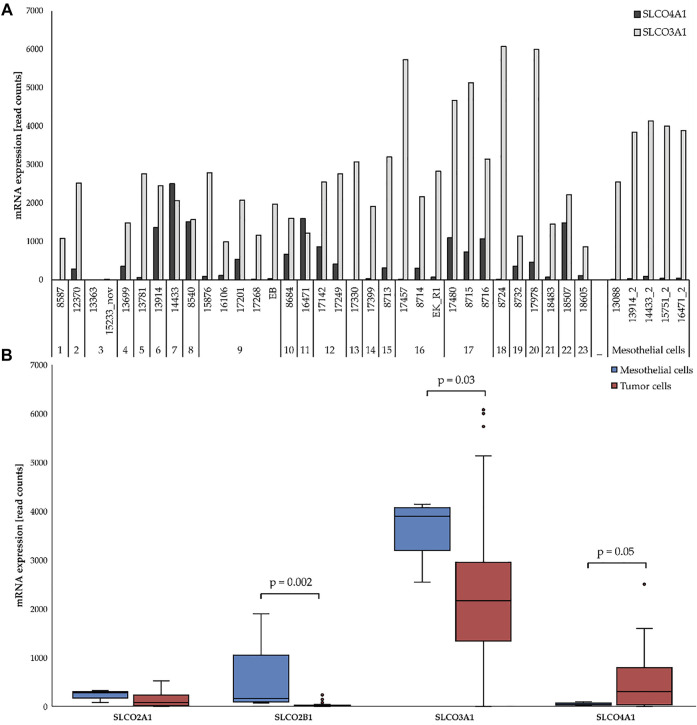
FIGURE 1.
mRNA expression of selected SLCOs in ovarian cancer cell lines (red) and mesothelial cells (blue). (A) SLCO4A1 and SLCO3A1 levels in 5 mesothelial and 33 ovarian cancer cell lines from HGSOC patients. Cell lines and the code for each patient are indicated at the bottom. (B) Expression of SLCO4A1 and three other genes in the ovarian cancer (red) and mesothelial (blue) group. Boxes include all data from the first to third quartile, with the indicated median. The upper and lower lines indicate the maximum and minimum values excluding any outliers. Outliers are indicated as dots. Statistical significance (p < 0.05).

