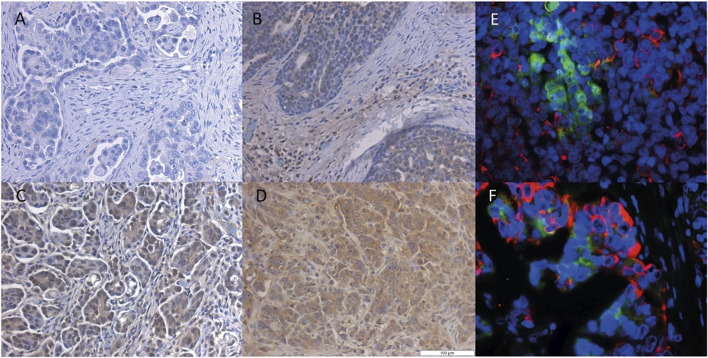
FIGURE 3.
Immunohistochemical staining of the OATP4A1 protein in FFPE samples from HGSOC. Representative IHC staining of ovarian cancer cells with different levels of SLCO4A1/OATP4A1 protein in FFPE samples images (B–D); the negative control FFPE sample is shown in image (A). Immunofluorescence staining of OATP4A1 and CK19 is shown in images (E–F) Red fluorescence indicates cytokeratin-19 and green fluorescence OATP4A1; blue indicates DAPI staining of nuclei (magnification ×40).

