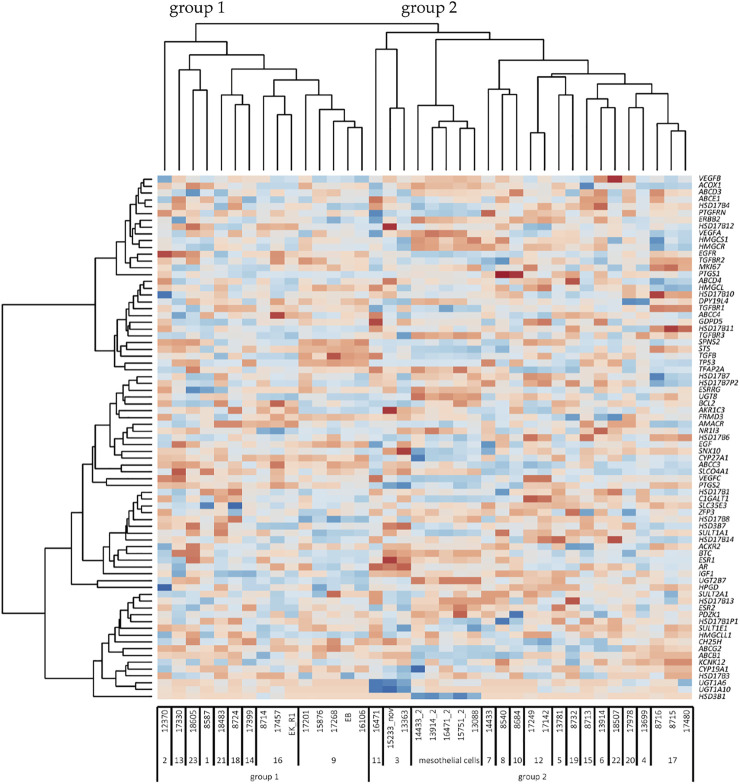
FIGURE 4.
Heatmap of unsupervised clustering analysis (n = 38 cell lines). Cell names are indicated below the heatmap. The numbers under the cell line names represent the code used for each patient. Group 1 and 2 indicates the two large cell clusters according to the pattern of genes (dark red, minimum log2 expression; dark blue, maximum log2 expression). On the right-hand side, the 77 genes are indicated. The 5 mesothelial cell lines have low levels of SLCO4A1, but the overall pattern of genes is related to group 2 of ovarian cancer cells. Note that various column clusters are built from cell lines obtained from the same patient.

