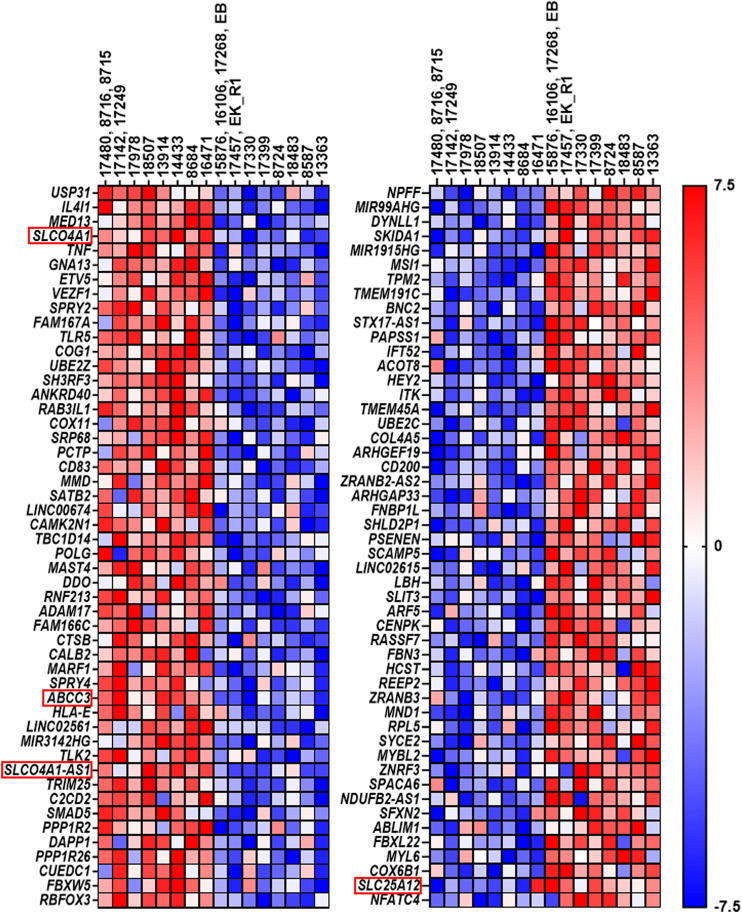
FIGURE 5.
Top 50 genes resulting from gene set enrichment analysis. The left side displays the top 50 genes in cell lines expressing the highest SLCO4A1 level, while the right side shows the top 50 genes, which were upregulated in cell lines expressing the lowest SLCO4A1 level. Each of the two columns is annotated with their respective cell lines. Again, the cell lines on the left side of each column show the higher expressing ones, while the right side shows the cell lines, which express the lowest level of SLCO4A1. In cases where several cell lines were derived from the same patient, the mean value of the RNA expression from these cell lines was calculated and used. Gene expression is normalized for each row; where red indicates higher expression while blue indicates the lower expression of the respective genes (ranked from −7.5 to 7.5).

