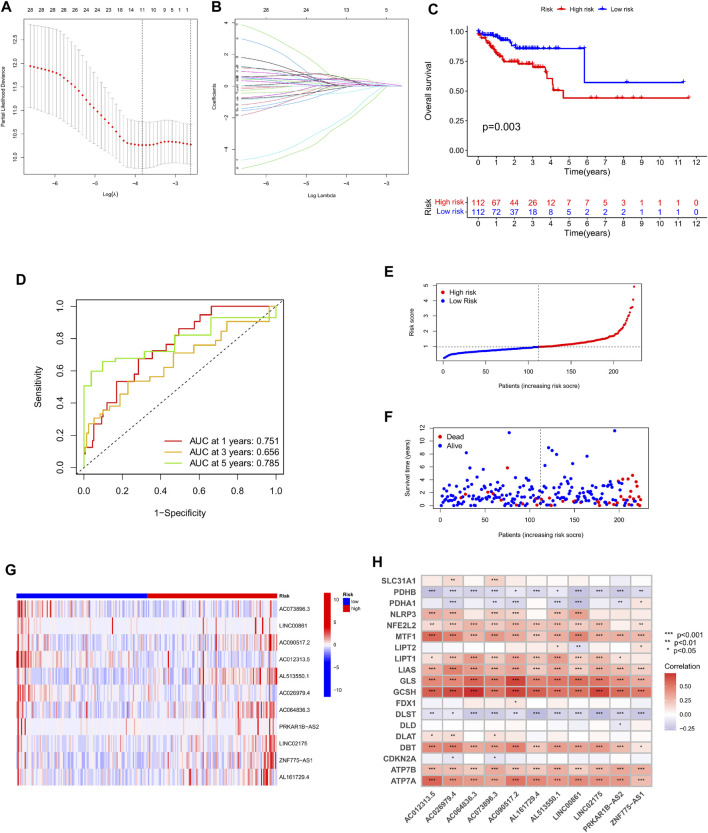
FIGURE 4.
Construction and evaluation of OS-related cuproptosis-related lncRNA risk scoring models in the training cohort. (A) LASSO coefficient curves of 11 prognosis-related lncRNAs. (B) Ten-fold cross-validation of tuning parameter selection in the LASSO model. (C) Kaplan-Meier curves of survival outcomes for patients in the high and low risk groups. (D) 1-year, 3-year, and 5-year ROC curves and AUC values of the risk scoring model. (E) Risk score distribution. Blue dots represent risk scores for low-risk patients; red dots represent risk scores for high-risk patients. (F) Relationship between survival status and risk score. The horizontal axis represents the number of patients, and the vertical axis represents the risk score. Red dots represent dead patients and blue dots represent surviving patients. (G) Heatmap showing the expression profiles of 11 characteristic lncRNAs. (H) Heatmap of the association of 11 characteristic lncRNAs with cuproptosis-related genes.

