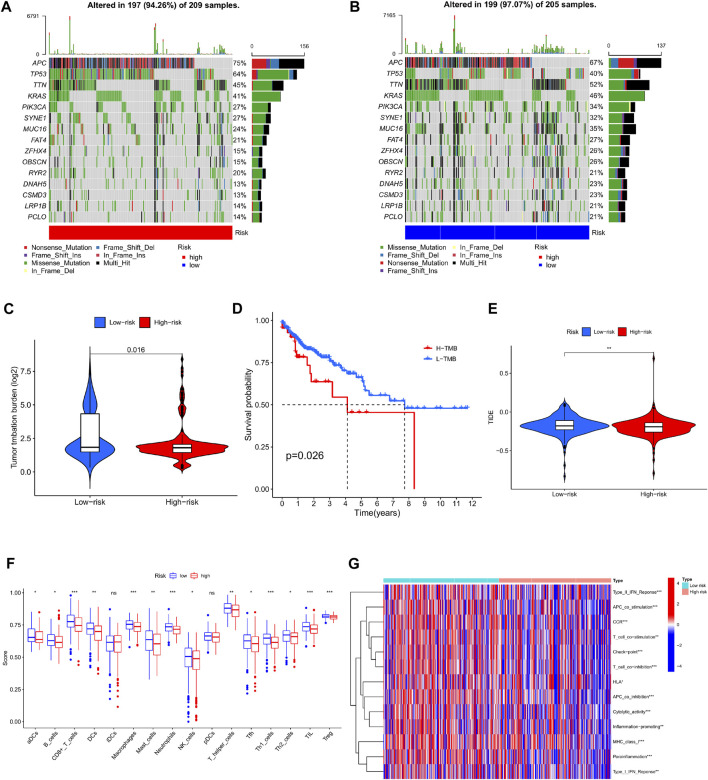
FIGURE 9.
Analysis of tumor mutation burden and immune function in high and low risk groups. (A) Waterfall plot of mutant genes in the high-risk group. (B) Waterfall plot of mutant genes in the low-risk group. (C) Violin plot of TMB contrast in high and low risk groups. (D) Kaplan-Meier curves of H-TMB and L-TMB. (E) TIDE violin plot between high and low risk groups (F) Boxplot comparison of immune infiltrating cells between high and low risk group. (G) Comparison of immune-related functions between high and low risk groups.

