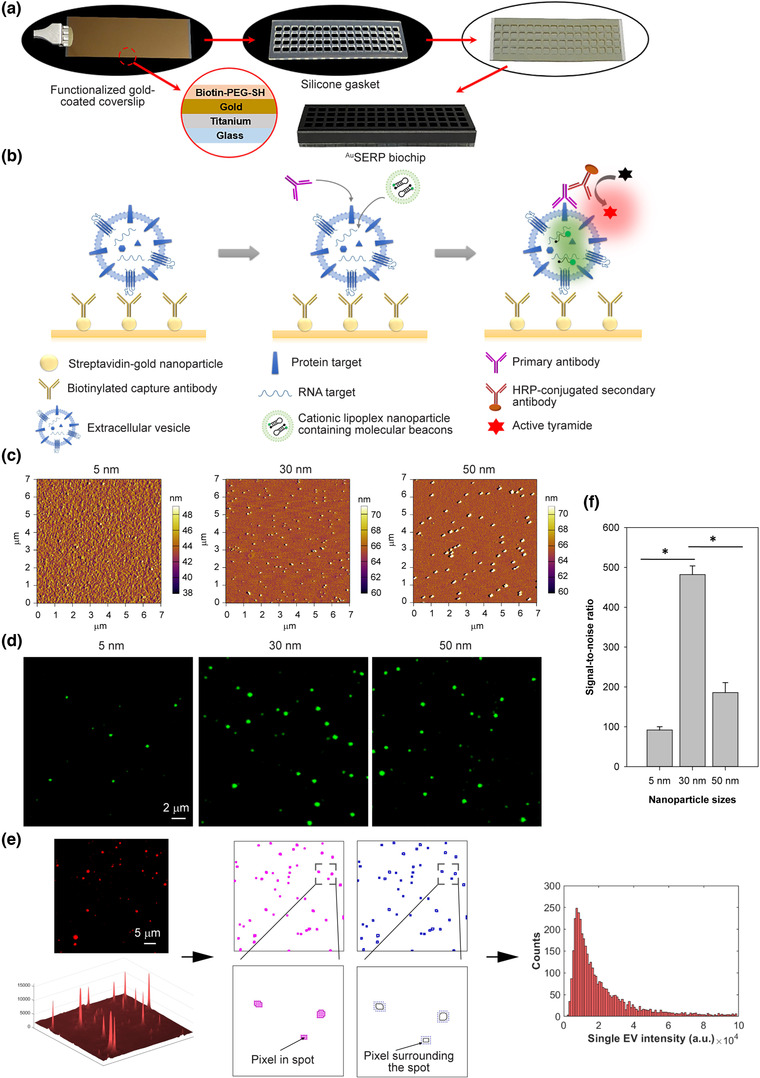
FIGURE 1.

Design, characterization, and optimization of AuSERP. (a) AuSERP assembly. A functionalized gold‐coated coverslip was attached to a silicone gasket with 64 chambers for high‐throughput analysis of single‐EV biomarkers. (b) A schematic representation of the mechanism of detection for protein and mRNA biomarkers present in single extracellular vesicles (EVs) using AuSERP. A gold‐coated coverslip with PEG‐tethered gold nanoparticles (NPs) conjugated to capture antibodies was used to immobilize single EVs. Proteins on the surface of the single EVs were detected using the corresponding primary antibody and a tyramide signal amplification (TSA) method, resulting in fluorescent signals. mRNA cargo was identified using target‐specific molecular beacons (MBs) encapsulated in cationic lipoplex nanoparticles (CLNs), resulting in fluorescent signals. (c) Atomic force microscopy (AFM) images of AuSERP coated with different‐sized gold NPs (5, 30, and 50 nm). (d) Representative total internal reflection fluorescence (TIRF) microscopy images of CD63 protein expression on the surface of H1568 single EVs captured with AuSERP with different NP sizes. The images were cropped and enlarged from their original images, which are provided in Figure S1(b). (e) Image processing workflow. Background noise signals surrounding bright spots were first removed using the Wavelet denoising method. All the pixels in each spot were then identified and subtracted by the mean intensity of pixels surrounding the spot. The noise‐subtracted intensities of each pixel within the spot were summed into a net intensity of the single EV. Net intensities of all single EVs in 100 TIRF microscopy images were then collected to generate a histogram of net fluorescence intensity. (e) A signal‐to‐noise ratio (SNR) comparison of AuSERP with different sized gold NPs for single‐EV capture. The signal was calculated from the total fluorescence intensity of the CD63 surface protein levels on every single EV (individual fluorescence spot). The data were expressed as mean ± SD; n = 3; *P < 0.0001, Student's t‐test. a.u., arbitrary units
