FIGURE 5.

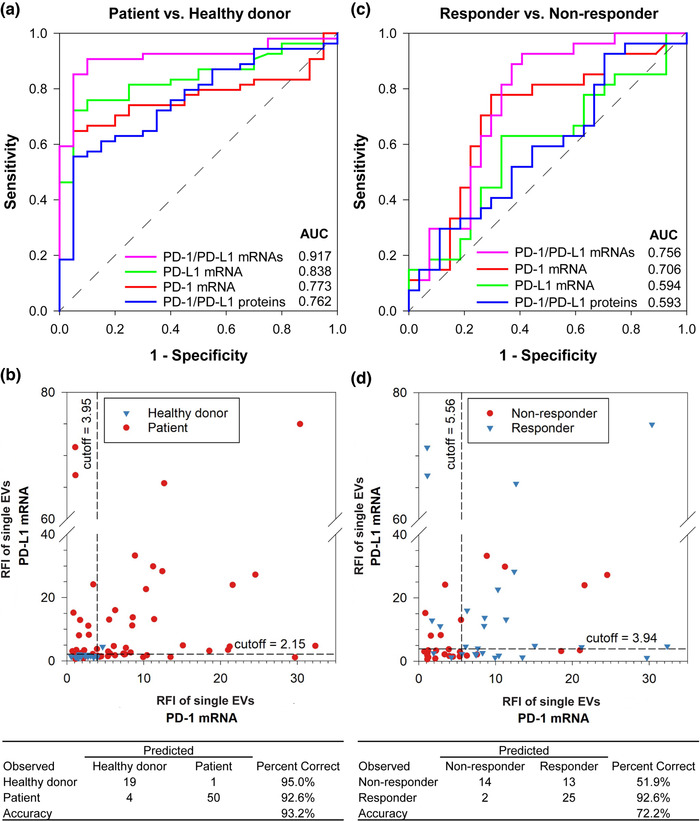
NSCLC diagnosis and prediction of immunotherapy response with AuSERP. (a) Receiver operating characteristic (ROC) curves for NSCLC diagnosis based on single‐EV analysis. (b) Scatter plot of fluorescence intensities of single‐EV dual PD‐1/PD‐L1 mRNA biomarkers. Optimal cut‐off values for NSCLC diagnosis based on single‐EV PD‐1/PD‐L1 mRNA signals were obtained from the ROC curves in Figure 5(a). An individual is diagnosed with NSCLC if either the single‐EV PD‐1 mRNA signal is larger than 3.95 or if the single‐EV PD‐L1 mRNA signal is larger than 2.15, lending a diagnostic accuracy of 93.2%. (c) ROC curves for predictions of NSCLC patient responses to anti‐PD‐1/PD‐L1 immunotherapy based on single‐EV analysis. (d) Scatter plot of fluorescence intensities of single‐EV dual PD‐1/PD‐L1 mRNA biomarkers. Optimal cut‐off values for immunotherapy prediction based on single‐EV PD‐1/PD‐L1 mRNA signals were obtained from the ROC curves in Figure 5(c). A patient is predicted as a responder if either the single‐EV PD‐1 mRNA signal is larger than 5.56 or if the single‐EV PD‐L1 mRNA signal is larger than 3.94, lending a prediction accuracy of 72.2%. 54 patients were evaluated (27 responders and 27 non‐responders), along with 20 healthy donors
