
FIGURE 2.
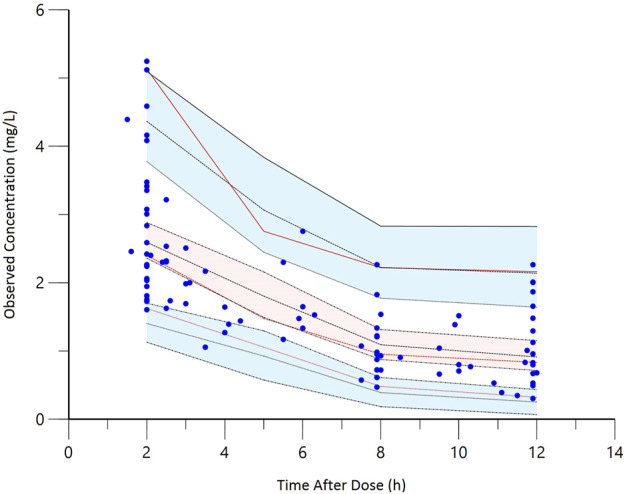
The prediction-corrected visual predictive check (pcVPC) of the final model. The red lines represent the 5th, 50th, and 95th percentiles of the observed concentrations; the shaded areas represent the 80% confidence intervals of the 5th, 50th, and 95th percentiles of the simulated concentrations; the dots represent the observed data.