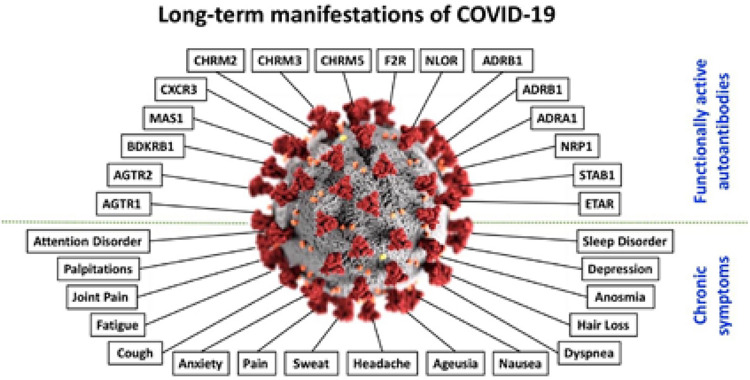
Figure 1.
Schematic representation of some of the functionally active autoantibodies linked to COVID-19. In the center is shown the SARS-CoV-2; around it, at the upper part of the figure, are the autoantibodies; at the bottom part of the figure appear some of the chronic symptoms associated with COVID-19. COVID-19 = Coronavirus disease 2019; SARS-CoV-2 = severe acute respiratory syndrome coronavirus 2. Reproduced with permission from Ref. 8.

