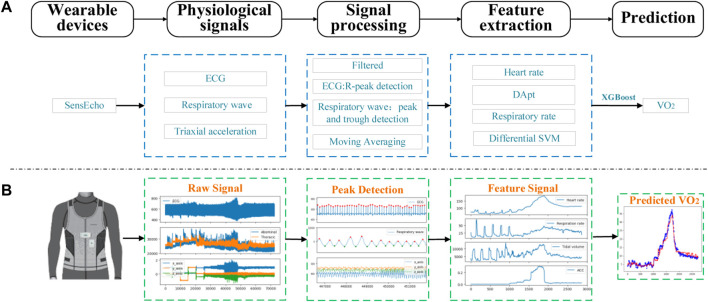
FIGURE 2.
The process of signal acquisition, preprocessing and estimation with SensEcho wearable device. (A) A flow chart of the entire experiment. (B) An example of the visualization of key signal processes. (Abbreviations: ECG, Electrocardiograph; DApt, the difference between the amplitude of the wave peaks and the amplitude of the troughs, SVM, the signal vector magnitude of triaxial accelerometer).

