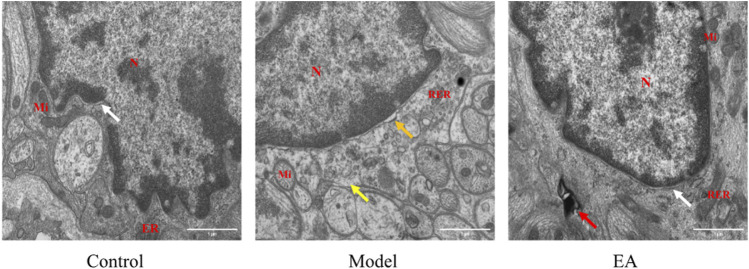
FIGURE 4.
Morphology of EGC in the muscle layer under TEM (×30,000). N: nucleus, Mi: mitochondrion, RER: rough endoplasmic reticulum. In the muscle layer, a widened perinuclear space ( ) and ribosome loss (
 ) were observed in the model group, mild autophagy (
 ) was observed in the EA group, and a normal perinuclear space (
 ) was observed both in the control and EA groups. Scale bar = 1 μm, n = 3.

