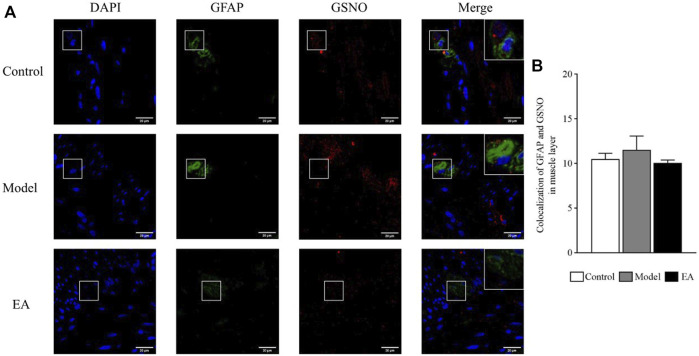
FIGURE 7.
Colocalized GFAP and GSNO expressions in the muscle layer. GFAP and GSNO fluorescence in different groups (A); green indicates GFAP, red indicates GSNO, and blue indicates DAPI-stained nucleus. One-way ANOVA indicated that the colocalization of GFAP and GSNO was not statistically different in different groups (B). Scale bar = 20 μm, bar: mean ± SE, n = 4.

