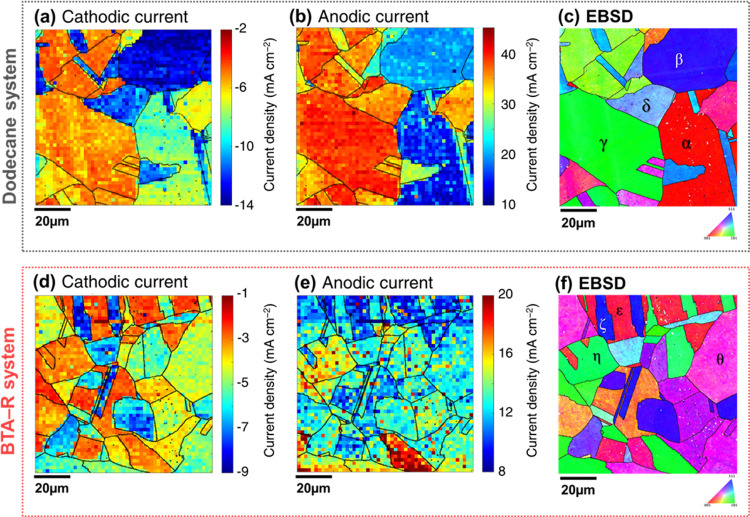
Figure 4.
Electrochemical images extracted from Movies S1 and S3 with respective crystallographic orientation maps. (a,b) Single frames of Movie S1 showing the current density recorded at (a) E = −0.44 V and (b) E = +0.24 V with pure dodecane as the oil phase. (c) Co-located crystallographic orientation map, obtained with EBSD after SECCM. (d,e) Single frames of Movie S3 showing the current density recorded at (d) E = −0.44 V and (e) E = +0.24 V with a solution of BTA-R 100 ppm in dodecane as the oil phase. (f) Co-located crystallographic orientation map, obtained with EBSD after SECCM. All electrochemical measurements were conducted with a 10 mM H2SO4 solution in the probe. For clarity, the grain boundaries identified from the crystallographic orientation map were overlaid on the electrochemical images. Relevant grains are marked with the letters α–θ on the EBSD maps.

