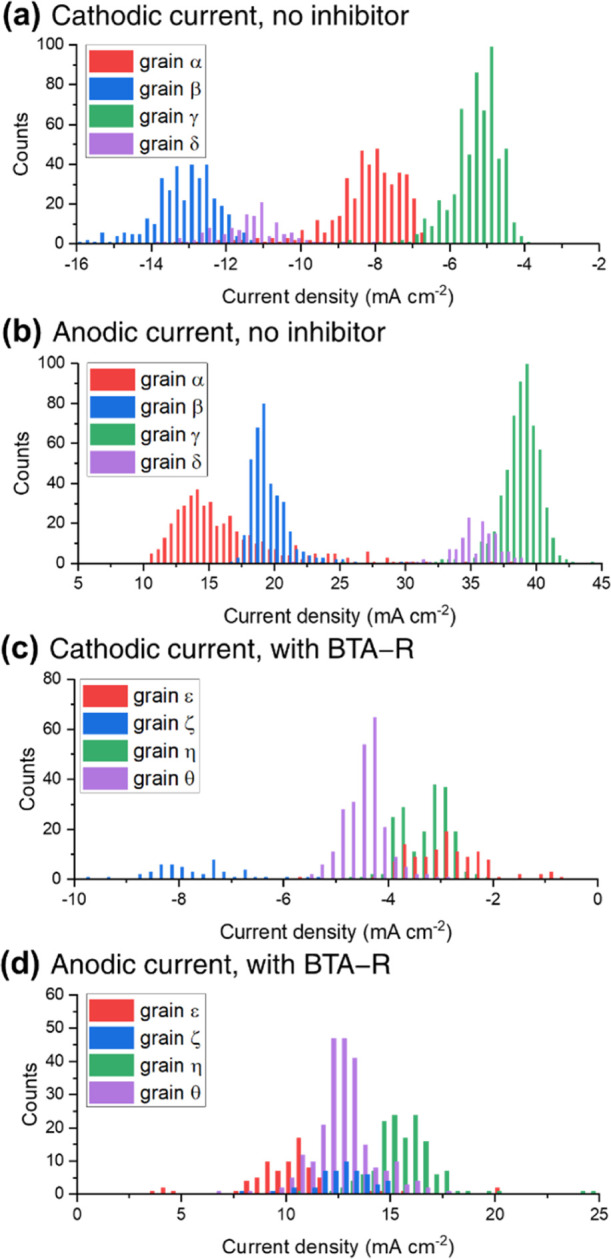
Figure 5.

Distribution of current densities on selected grains, indicated in Figure 4c,f: (a,b) without the inhibitor at (a) E = −0.44 V and (b) E = +0.24 V, extracted, respectively, from Figure 4a,b for grains α–δ; (c,d) with BTA-R at (c) E = −0.44 V and (d) E = +0.24 V, extracted, respectively, from Figure 4d,e and grains ε–θ.
