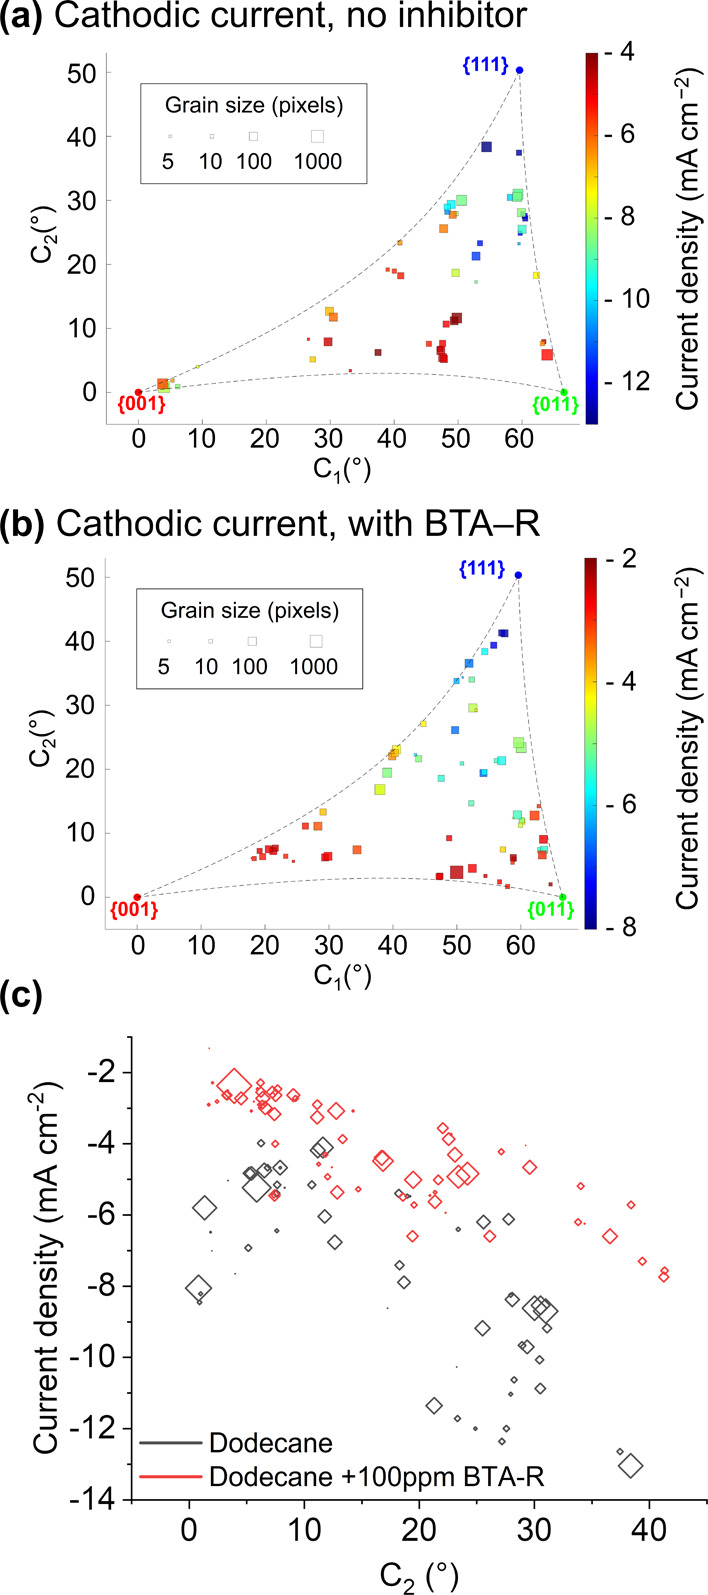
Figure 6.

Correlation plots between the crystallographic orientation and the median current density of the cathodic processes (i.e., at −0.44 V) (a) in the absence and (b) in the presence of BTA-R in the dodecane phase. The plot shown in (a) was elaborated from the correlation of Movies S1 and S2 (Figures 4a and S8a) with the IPFz EBSD maps reported in Figures 4c and S8c, while the plot shown in (b) was obtained from the correlation of Movies S3 and S4 (Figures 4d and S8d) with the IPFz EBSD maps reported in Figures 4f and S8f. (c) Correlation plot of the current density at −0.44 V as a function of the sole C2 coordinate, extracted from both (a) (gray shapes) and (b) (red shapes).
