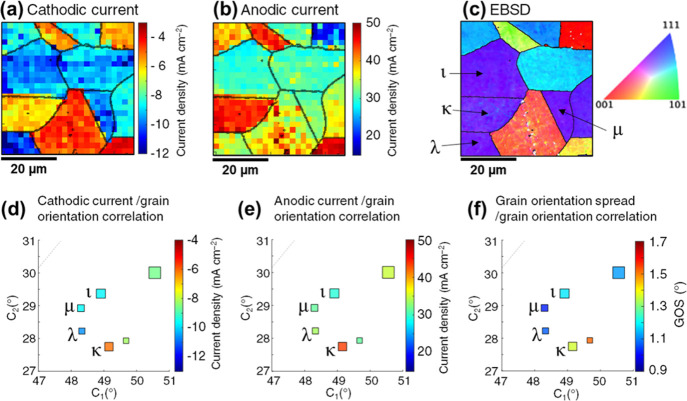
Figure 8.
(a,b) Extracts of current density maps from Movie S2, respectively, (a) at −0.44 V (full image in figure) and (b) at +0.24 V (full image in Figure S8b). (c) Corresponding IPFz EBSD map (extract of Figure S8c). (d–f) Extracts of 2D correlation plots shown in (d) Figure 6a and (e) Figure 7a with a magnified scale, with the addition of (f) grain orientation spread of the same grains (obtained from Figures 4c and S8c; the full plot is shown in the Supporting Information, Figure S11).

