
Figure 2.
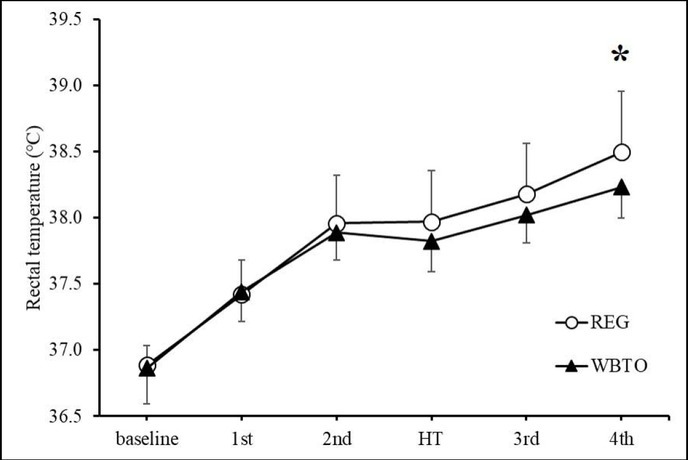
Changes in rectal temperature during the experimental session in REG (○) and WBTO (▲). Values are expressed as means ± SD (n=0). 1st: at the end of the 1stquarter, 2nd: at the end of the 2ndquarter, 3rd: at the end of the 3rdquarter, 4th: at the end of the 4thquarter, HT: half-time.
* p<0.05 denotes a significant difference between the WBTO and REG conditions.