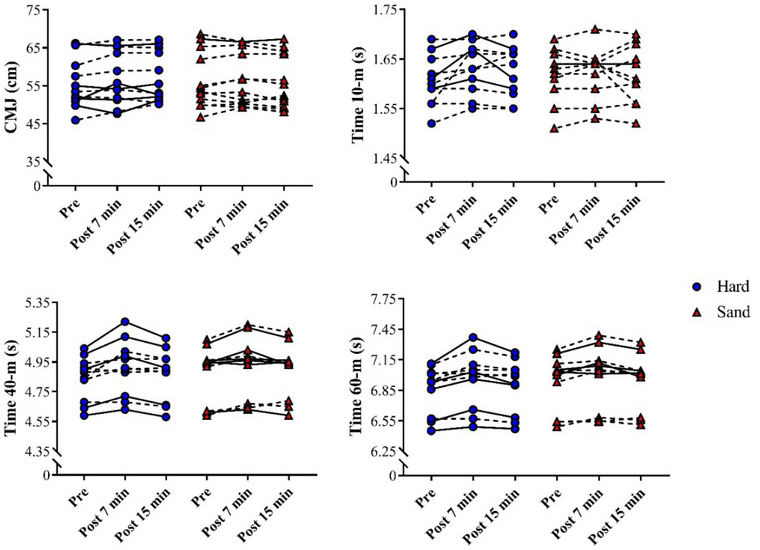
Figure 3.

Individual variations in countermovement jump (CMJ) height and sprint times over different distances. Dashed lines indicate % changes higher than the CV values; solid lines indicate % changes lower than the CV values.

Individual variations in countermovement jump (CMJ) height and sprint times over different distances. Dashed lines indicate % changes higher than the CV values; solid lines indicate % changes lower than the CV values.