
Figure 3.
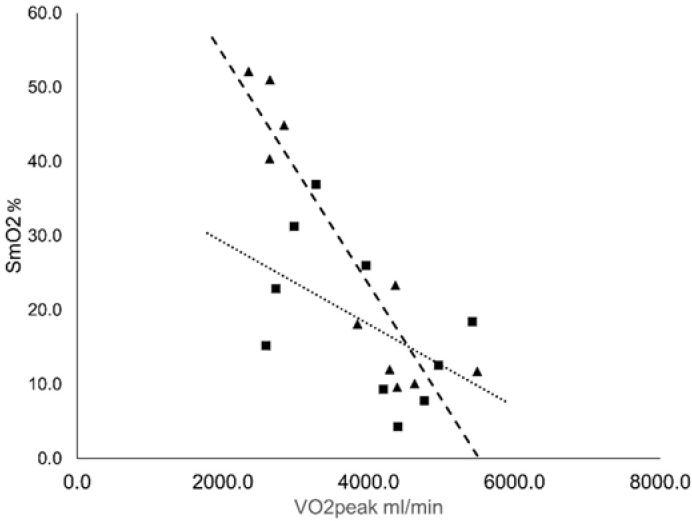
Relationship between minimally attained SmO2 value and VO2peak at voluntary exhaustion. The dotted line illustrates the line of the best fit for running (■); R2 = 0.266. The dashed line illustrates the line of the best fit for cycling (▲); R2 = 0.8512.