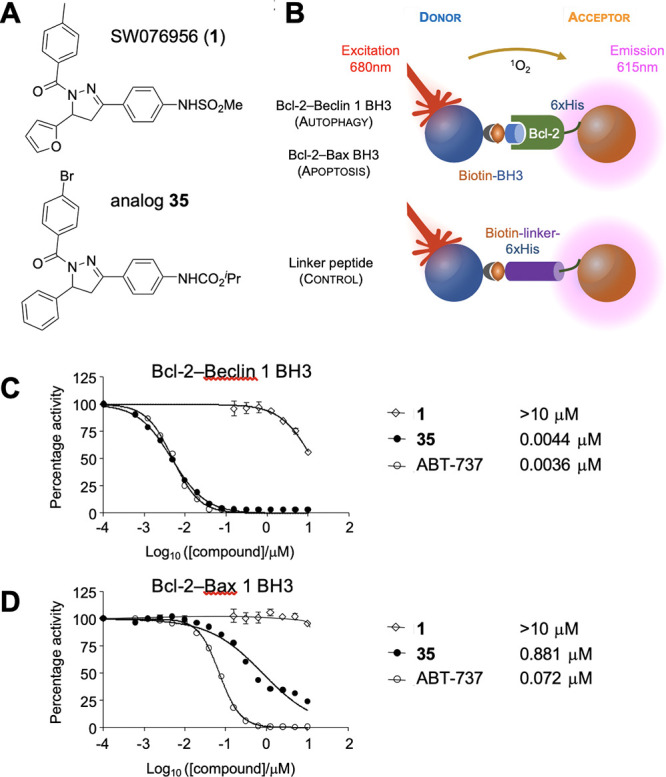
Figure 2.

Compound structures, AlphaLISA assay, and representative dose–response quantification of Bcl-2–Beclin 1 BH3 and Bcl-2–Bax BH3 protein–protein interactions. (A) Structures of SW076956 (1) and analogue 35. (B) Design of the AlphaLISA assay. Details can be found in ref (13). (C and D) Quantification of the Bcl-2–Beclin 1 (C) and the Bcl-2–Bax interaction (D). Dose–response curves for compounds 1, 35, and the nonselective Bcl-2 inhibitor ABT-737 for the indicated interactions. Dose–response curves were analyzed using the nonlinear regression function in Prism 7.0 (GraphPad).
