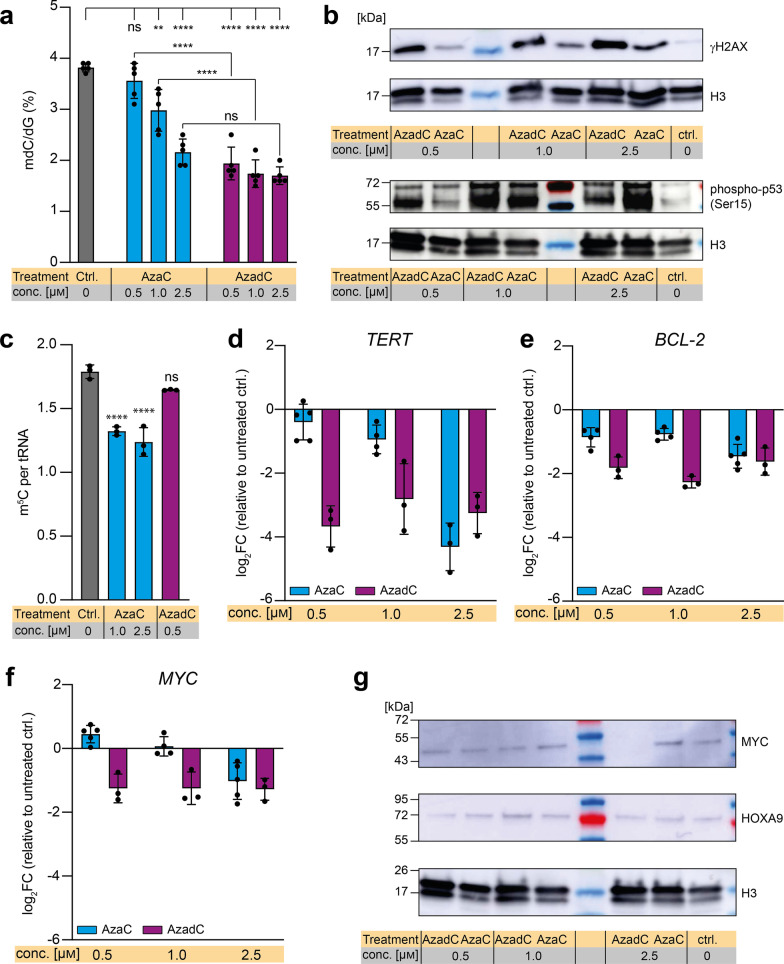
Fig. 1.
Response of MOLM-13 to AzaC and AzadC treatment on epigenome, DNA damage and gene expression level. a UHPLC-QQQ-MS was used to quantify global mdC levels after exposure to 0.5 µM, 1.0 µM or 2.5 µM AzaC or AzadC for 72 h. Untreated cells served as a control. Ordinary one-way ANOVA with Tukey’s multiple comparisons test was performed. b Immunoblot analysis of γH2AX and phospho-p53 (Ser15) levels (nuclear fraction) after exposure to 0.5 µM, 1.0 µM or 2.5 µM AzaC or AzadC for 48 h. c UHPLC-QQQ-MS was used to measure the m5C content per tRNA after exposure to 1.0 µM or 2.5 µM AzaC or 0.5 µM AzadC for 72 h. Untreated cells served as a control. Ordinary one-way ANOVA with Dunnett’s multiple comparisons test was performed. d–f RT-qPCR data to quantify gene expression on the transcript level of TERT (d), BCL-2 (e) and MYC (f), after 72 h exposure to 0.5 µM, 1.0 µM or 2.5 µM AzaC or AzadC. The log2 fold changes (log2FC) of the transcripts in relation to the untreated control are displayed. g Immunoblot analysis of MYC and HOXA9 protein levels after exposure to 0.5 µM, 1.0 µM or 2.5 µM AzaC or AzadC for 48 h a, c–f Each dot represents one independent experiment. Bars show mean, and error bars represent standard deviation. All p values were adjusted for multiple comparisons testing. ns padj ≥ 0.05, *padj < 0.05, **padj < 0.01, ***padj < 0.001, ****padj < 0.0001. b, g Histone H3 served as a loading ctrl. Untreated cells served as a biological control. a Details about the analysis, including exact p values, are given in Additional file 10: Table S9. b Details about the analysis, including exact p values, are given in Additional file 11: Table S10

