Fig. 4.
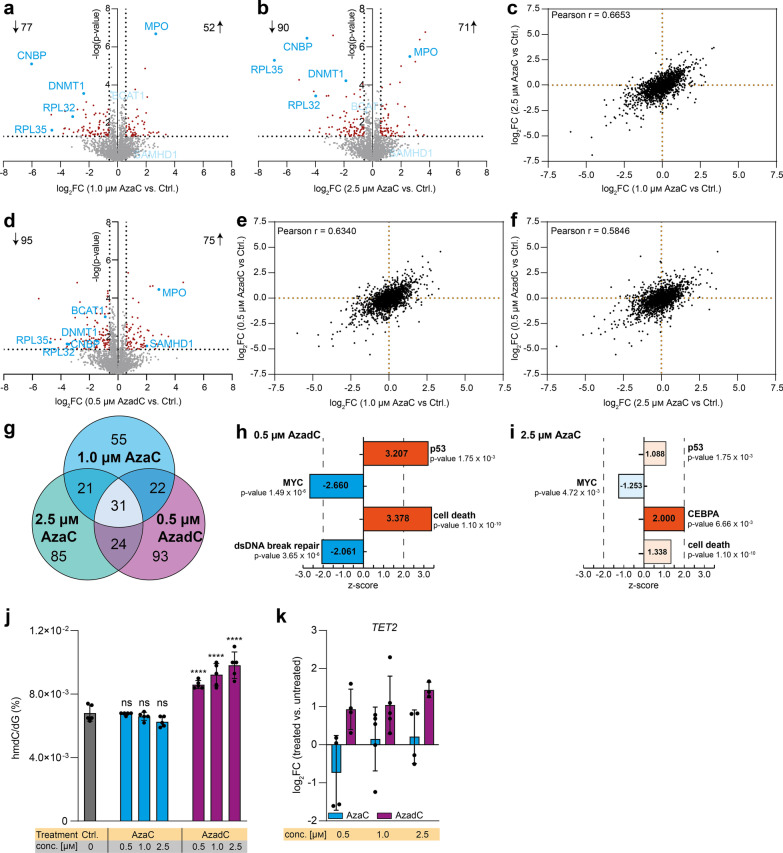
Full-proteome analysis of MOLM-13 and TET activity after 72 h AzaC or AzadC treatment. a, b Volcano plot of differentially expressed proteins of a 1.0 µM AzaC and b 2.5 µM AzaC-treated cells versus untreated control. c Correlation plot where the log2FC after treatment with 1.0 µM AzaC and 2.5 µM AzaC is displayed for each protein without considering the p value for the enrichment or depletion. d Volcano plot of differentially expressed proteins of 0.5 µM AzadC-treated cells versus untreated control. e Correlation plot where the log2FC after treatment with 1.0 µM AzaC and 0.5 µM AzadC is displayed for each protein without considering the p value for the enrichment or depletion. f Correlation plot where the log2FC after treatment with 2.5 µM AzaC and 0.5 µM AzadC is displayed for each protein without considering the p value for the enrichment or depletion. g Venn diagram of the differentially expressed proteins after 1.0 µM AzaC, 2.5 µM AzaC and 0.5 µM AzadC treatment. Commonly differentially expressed proteins are indicated by the overlap between two or more treatments. h Results of the Ingenuity Pathway Analysis (IPA) of the proteome changes of AzadC (0.5 µM)-treated MOLM-13 compared to the untreated control. i Results of the IPA of the proteome changes of AzaC (2.5 µM)-treated MOLM-13 compared to the untreated control. j UHPLC-QQQ-MS was used to quantify global hmdC levels after exposure to 0.5 µM, 1.0 µM or 2.5 µM AzaC or AzadC for 72 h. Untreated cells served as a control. Ordinary one-way ANOVA with Tukey’s multiple comparisons test was performed. ns padj ≥ 0.05, ****padj < 0.0001. k RT-qPCR data to quantify gene expression on the transcript level of TET2 after 72 h exposure to 0.5 µM, 1.0 µM or 2.5 µM AzaC or AzadC. The log2 fold changes (log2FC) of the transcripts in relation to the untreated control are displayed. a, b, d For each treatment (1.0 µM AzaC, 2.5 µM AzaC, 0.5 µM AzadC, untreated ctrl), four biologically independent experiments were performed and measured. Proteins were considered as differentially expressed when the criteria log2FC >|0.58496| (fold change >|1.5|) and -log(p value) > 1.301 (p value < 0.05) were both fulfilled. Left side of volcano plot: proteins depleted after Aza treatment, right side of volcano plot: proteins enriched after Aza treatment. c, e, f log2FC for each detected protein of (a, b, d), regardless of the p value, in comparison with each other. Pearson correlation coefficient was calculated. i, j p value indicates p value of overlap for the Fisher’s Exact Test. The number in the bars displays the z-score, a z-score > 0 indicates activation, z-score < 0 indicates inhibition. Z-score ≥|2| was considered as significantly activated or inhibited, respectively. P53, MYC and CEBPA are part of the “Upstream Regulator Analysis.” Cell death and dsDNA break repair are part of the “Disease and function” analysis. Detailed results are listed in Additional file 6 Table S5. j, k Bar shows mean, and error bars show standard deviation. Each dot represents one biologically independent experiment

