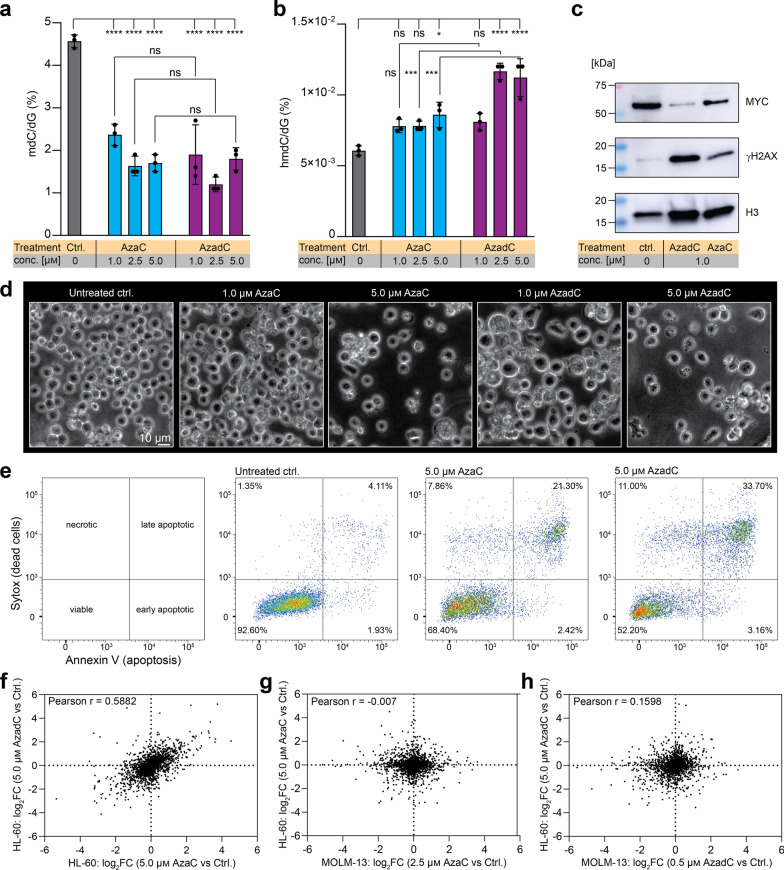
Fig. 5.
Effects of AzaC and AzadC on the acute promyelocytic leukemia cell line HL-60. a, b UHPLC-QQQ-MS was used to quantify global mdC (a) and hmdC (b) levels after exposure to 1.0 µM, 2.5 µM or 5.0 µM AzaC or AzadC for 72 h. Untreated cells served as a control. Ordinary one-way ANOVA with Tukey’s multiple comparisons test was performed. Each dot represents one independent experiment. Bars show mean, and error bars represent standard deviation. All p values were adjusted for multiple comparisons testing. ns padj ≥ 0.05, *padj < 0.05, **padj < 0.01, ***padj < 0.001, ****padj < 0.0001. c Immunoblot analysis of γH2AX and MYC (nuclear fraction) after exposure to 1.0 µM AzaC or AzadC for 72 h. d Brightfield microscopy images of HL-60 treated for 72 h with different concentrations of either AzaC or AzadC. Untreated cells served as a control. e Flow cytometric analysis of cell death after 72 h treatment with either 5.0 µM of AzaC or AzadC. Cells that were Annexin V low and Sytox™ low cells were considered viable, cells only high in Sytox as necrotic, cells only high in Annexin V as early apoptotic and cells high in both as late apoptotic. f Correlation plot where the log2FC after treatment with 5.0 µM AzaC and 5.0 µM AzadC is displayed for each protein without considering the p value for the enrichment or depletion. g Correlation plot where the log2FC after treatment with 2.5 µM AzaC in MOLM-13 and 5.0 µM AzaC in HL-60 is displayed for each protein without considering the p value for the enrichment or depletion. h Correlation plot where the log2FC after treatment with 0.5 µM AzadC in MOLM-13 and 5.0 µM AzadC in HL-60 is displayed for each protein without considering the p value for the enrichment or depletion. a Details about the analysis, including exact p values, are given in Additional file 15: Table S14. b Details about the analysis, including exact p values, are given in Additional file 16: Table S15

