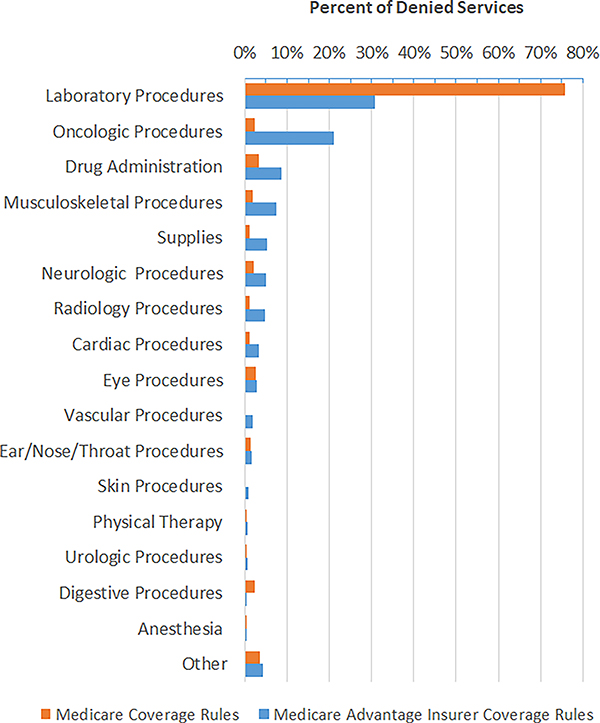
Exhibit 3 (Figure). Distribution of denials across broad service type.
Source: Authors’ calculations, 2014–2019 Aetna Medicare Advantage claims.
Notes: The share of denied services is presented for each service type, defined by broad service category The category “other” includes service categories with the least associated spending, collectively 4.2% of all denied spending. The denominator for each share is the total number of services denied within each category of coverage rules (traditional Medicare or Aetna Medicare Advantage).

