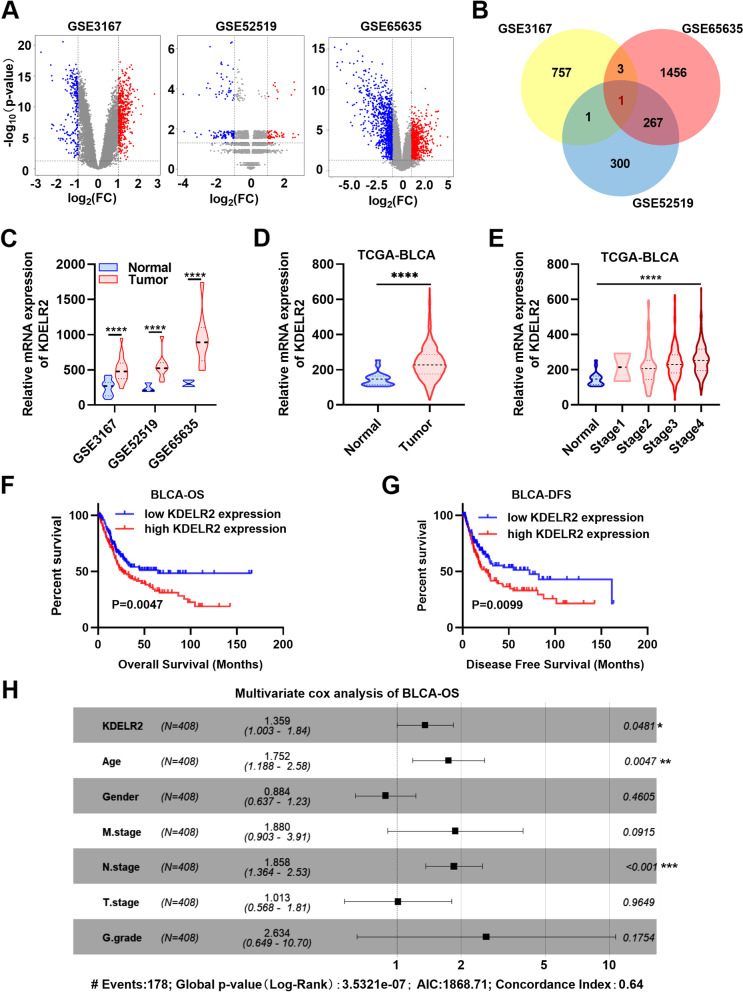
Fig. 1.
Identification and clinical characterisation of KDELR2 in BCa. A Volcano maps of the DEGs in BCa based on the GSE3167 (n = 765: upregulated, 232; downregulated, 533), GSE52519 (n = 573, upregulated, 236; downregulated, 337) and GSE65635 datasets (n = 1746, upregulated, 929; downregulated, 817). B A Venn diagram of the three independent GEO datasets (GSE3167, GSE52519 and GSE65635). C Expression profiles of KDELR2 mRNA in the three independent GEO datasets. D Expression profiles of KDELR2 mRNA in TCGA-BLCA dataset (normal, n = 19; tumor, n = 408). E KDELR2 mRNA levels at different clinical stages (normal, n = 19; StageI, n = 2; StageII, n = 130; Stage III, n = 140; Stage IV, n = 134). F-G Kaplan–Meier curves of KDELR2 expression in patients with BCa in TCGA-BLCA dataset (OS: high, n = 204; low, n = 204; DFS: high, n = 160; low, n = 159). H Multivariate analyses of the KDELR2 mRNA level and OS of patients with BCa. p < 0.05, *; p < 0.01, **; p < 0.001, ***; p < 0.0001,****

