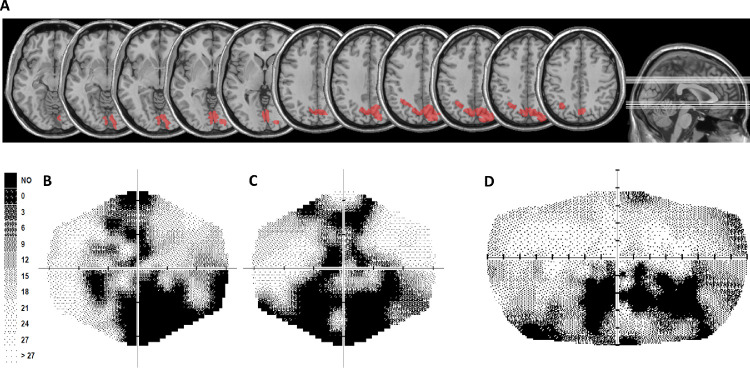
Figure 1.
(A) Patient S.T. lesion reconstruction. The image shows patient S.T. lesion projected onto axial slices of the standard MNI brain. In each slice the left hemisphere is on the left side. The levels of the axial slices are marked by white lines on the sagittal view of the brain (right). (B-D) Computerized automated visual perimetry of S.T. Greyscale images for the left (B) and the right (C) eye and for the binocular visual field (D). Axial hash marks denote 10 visual degree increments. Color map reports decibel values corresponding with each point in the gray scale.

