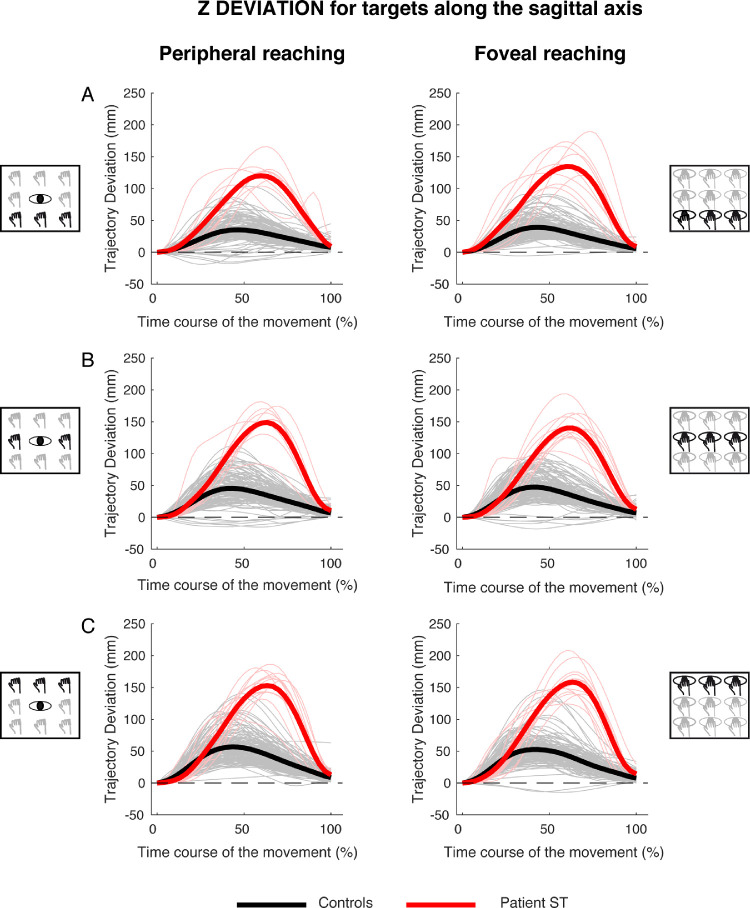
Figure 10.
Z deviations of reaching trajectory toward targets along the sagittal axis. (A, left) Temporal evolution of the horizontal deviations from the straight trajectory for reaching to near targets in peripheral reaching in patient S.T. (red line) and control participants (black line). (Right) Temporal evolution of the horizontal trajectory deviations for reaching to near targets in foveal reaching. (B, left) Temporal evolution of the horizontal trajectory deviations for reaching to intermediate targets in peripheral reaching. (Right) Temporal evolution of the horizontal trajectory deviations for reaching to intermediate targets in foveal reaching. (C, left) Temporal evolution of the horizontal trajectory deviations for reaching to far targets in peripheral reaching. (Right) Temporal evolution of the horizontal trajectory deviations for reaching to far targets in foveal reaching.

