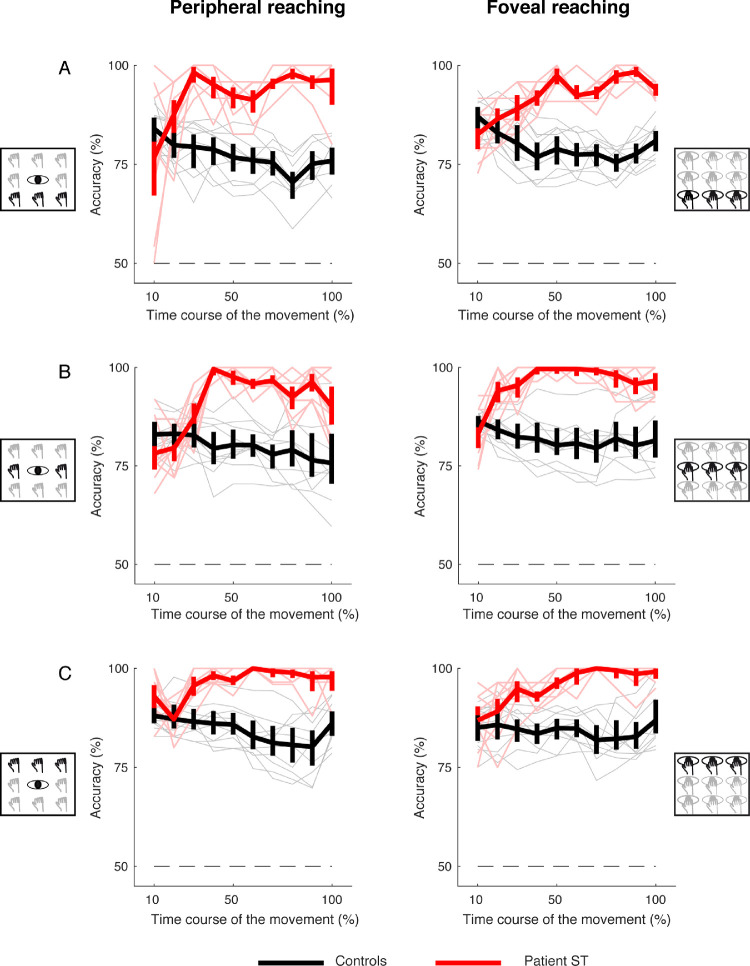
Figure 12.
Binary classification analysis aiming to evaluate whether the classifier was able in classifying the patient's performance from each of the controls for targets along the sagittal axis. (A) Average recognition rate of classification accuracy for near targets between patient and controls (red plots) and between controls (black plots). (B) Averaged recognition rate of classification accuracy for intermediate targets. (C) Averaged recognition rate of classification accuracy for far targets. The thin lines represent individual accuracies. The straight dotted line represents the chance level (50%).

