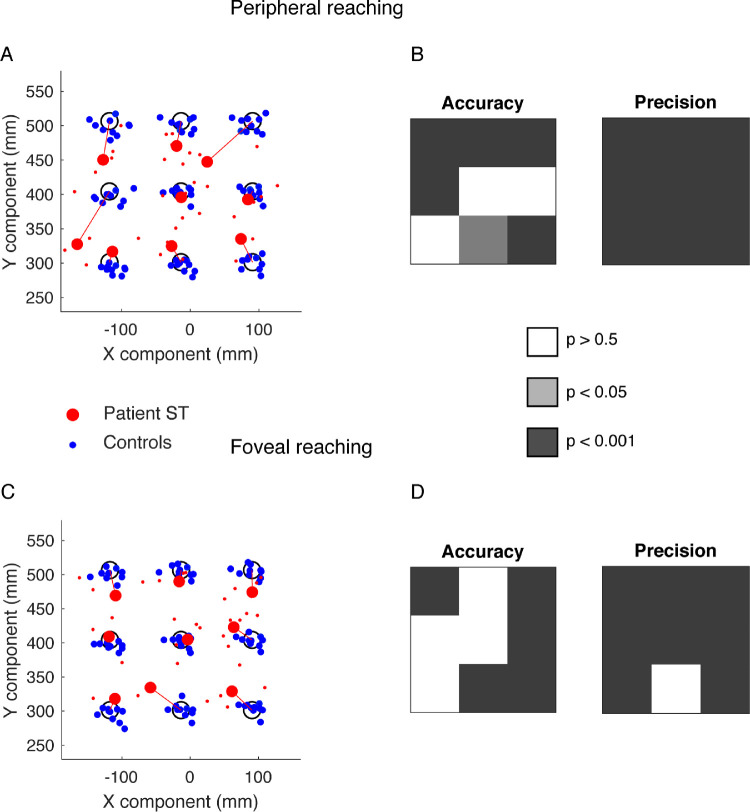
Figure 3.
Reaching end points of patient S.T. and control participants. (A) Averaged reaching end points calculated in the peripheral reaching for control participants (blue dots) and patient S.T. (red dots). Red lines represent the patient's end point accuracy (B) P values of patient's accuracy (left) and precision (right) in peripheral reaching. (C) Averaged reaching end points calculated in the foveal reaching for control participants (blue dots) and patient S.T. (red). (D) P values of patient's accuracy (left) and precision (right) in foveal reaching.

