Fig. 4.
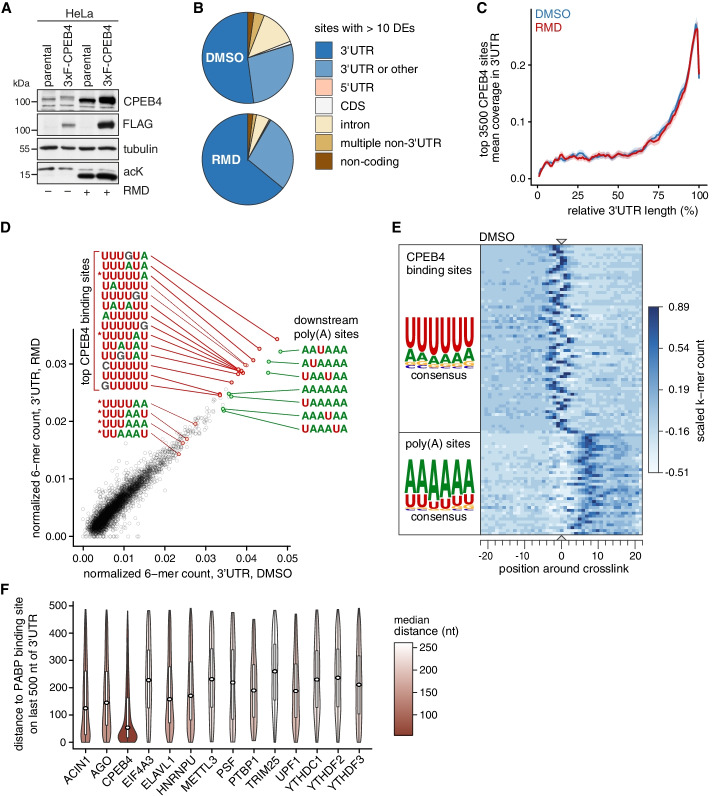
Identification of CPEB4 binding sites by PAR-CLIP. A Western blot analysis of CPEB4 protein expression in parental HeLa cells and HeLa cells expressing endogenously tagged 3xFLAG (3xF)-CPEB4. Cells were treated with 20 nM RMD or an equal volume of solvent (DMSO) for 16 h. B Distribution of transcript categories containing CPEB4 binding sites derived from PAR-CLIP experiments in DMSO- and RMD-treated HeLa-3xF-CPEB4 cells. Only sites with ≥ 10 diagnostic events (DEs), comprising the sum of T deletions and T-to-C conversions, are shown. Category “3′UTR or other” indicates overlap of a 3′UTR annotation and another category on the same strand. Category “multiple non-3′UTR” includes any number of overlapping annotation categories except 3′UTR. C Coverage profile of CPEB4 binding along the length of binned 3′UTRs. Plotted are equal length windows (50 nt) around crosslink centers of the 3500 top scoring CPEB4 binding sites over target 3′UTRs common for both DMSO- and RMD-treated conditions. Each 3′UTR is scaled to 100 bins. D Scatterplot showing normalized counts of the top 100 3′UTR-located 6-mers within 50-nt windows aligned at the crosslink centers in the DMSO- and RMD-treated condition. Counts were normalized by the 6-mer count in all 3′UTRs, and the sequence is shown for the most abundant 6-mers and 6-mers matching the canonical CPE (marked with *). E Heatmap showing scaled count of the 100 most abundant 6-mers in 50-nt windows around crosslink centers in DMSO-treated HeLa-3xF-CPEB4 cells. Each line represents one 6-mer. Color intensity corresponds to scaled frequency of this 6-mer over all 3′UTR CPEB4 binding sites. The position refers to the center (nt 3) of the 6-mers. On the left side, 6-mers were segregated by position into 2 clusters using k-means clustering, and the positional weight matrix is shown for each cluster. F Distribution of distances between 3′UTR binding sites of PABP and other RBPs including CPEB4. The distance from the center of the RBP binding site to the center of the closest downstream PABP binding site on the same 3′UTR, within 500 nt of the annotated 3′end, was calculated. CLIP data from this study (CPEB4, DMSO-treated condition) and published datasets (Additional file 7) were used

