
Figure 2. Differentiation of E. coli from polystyrene beads by phenotypic features tracking.
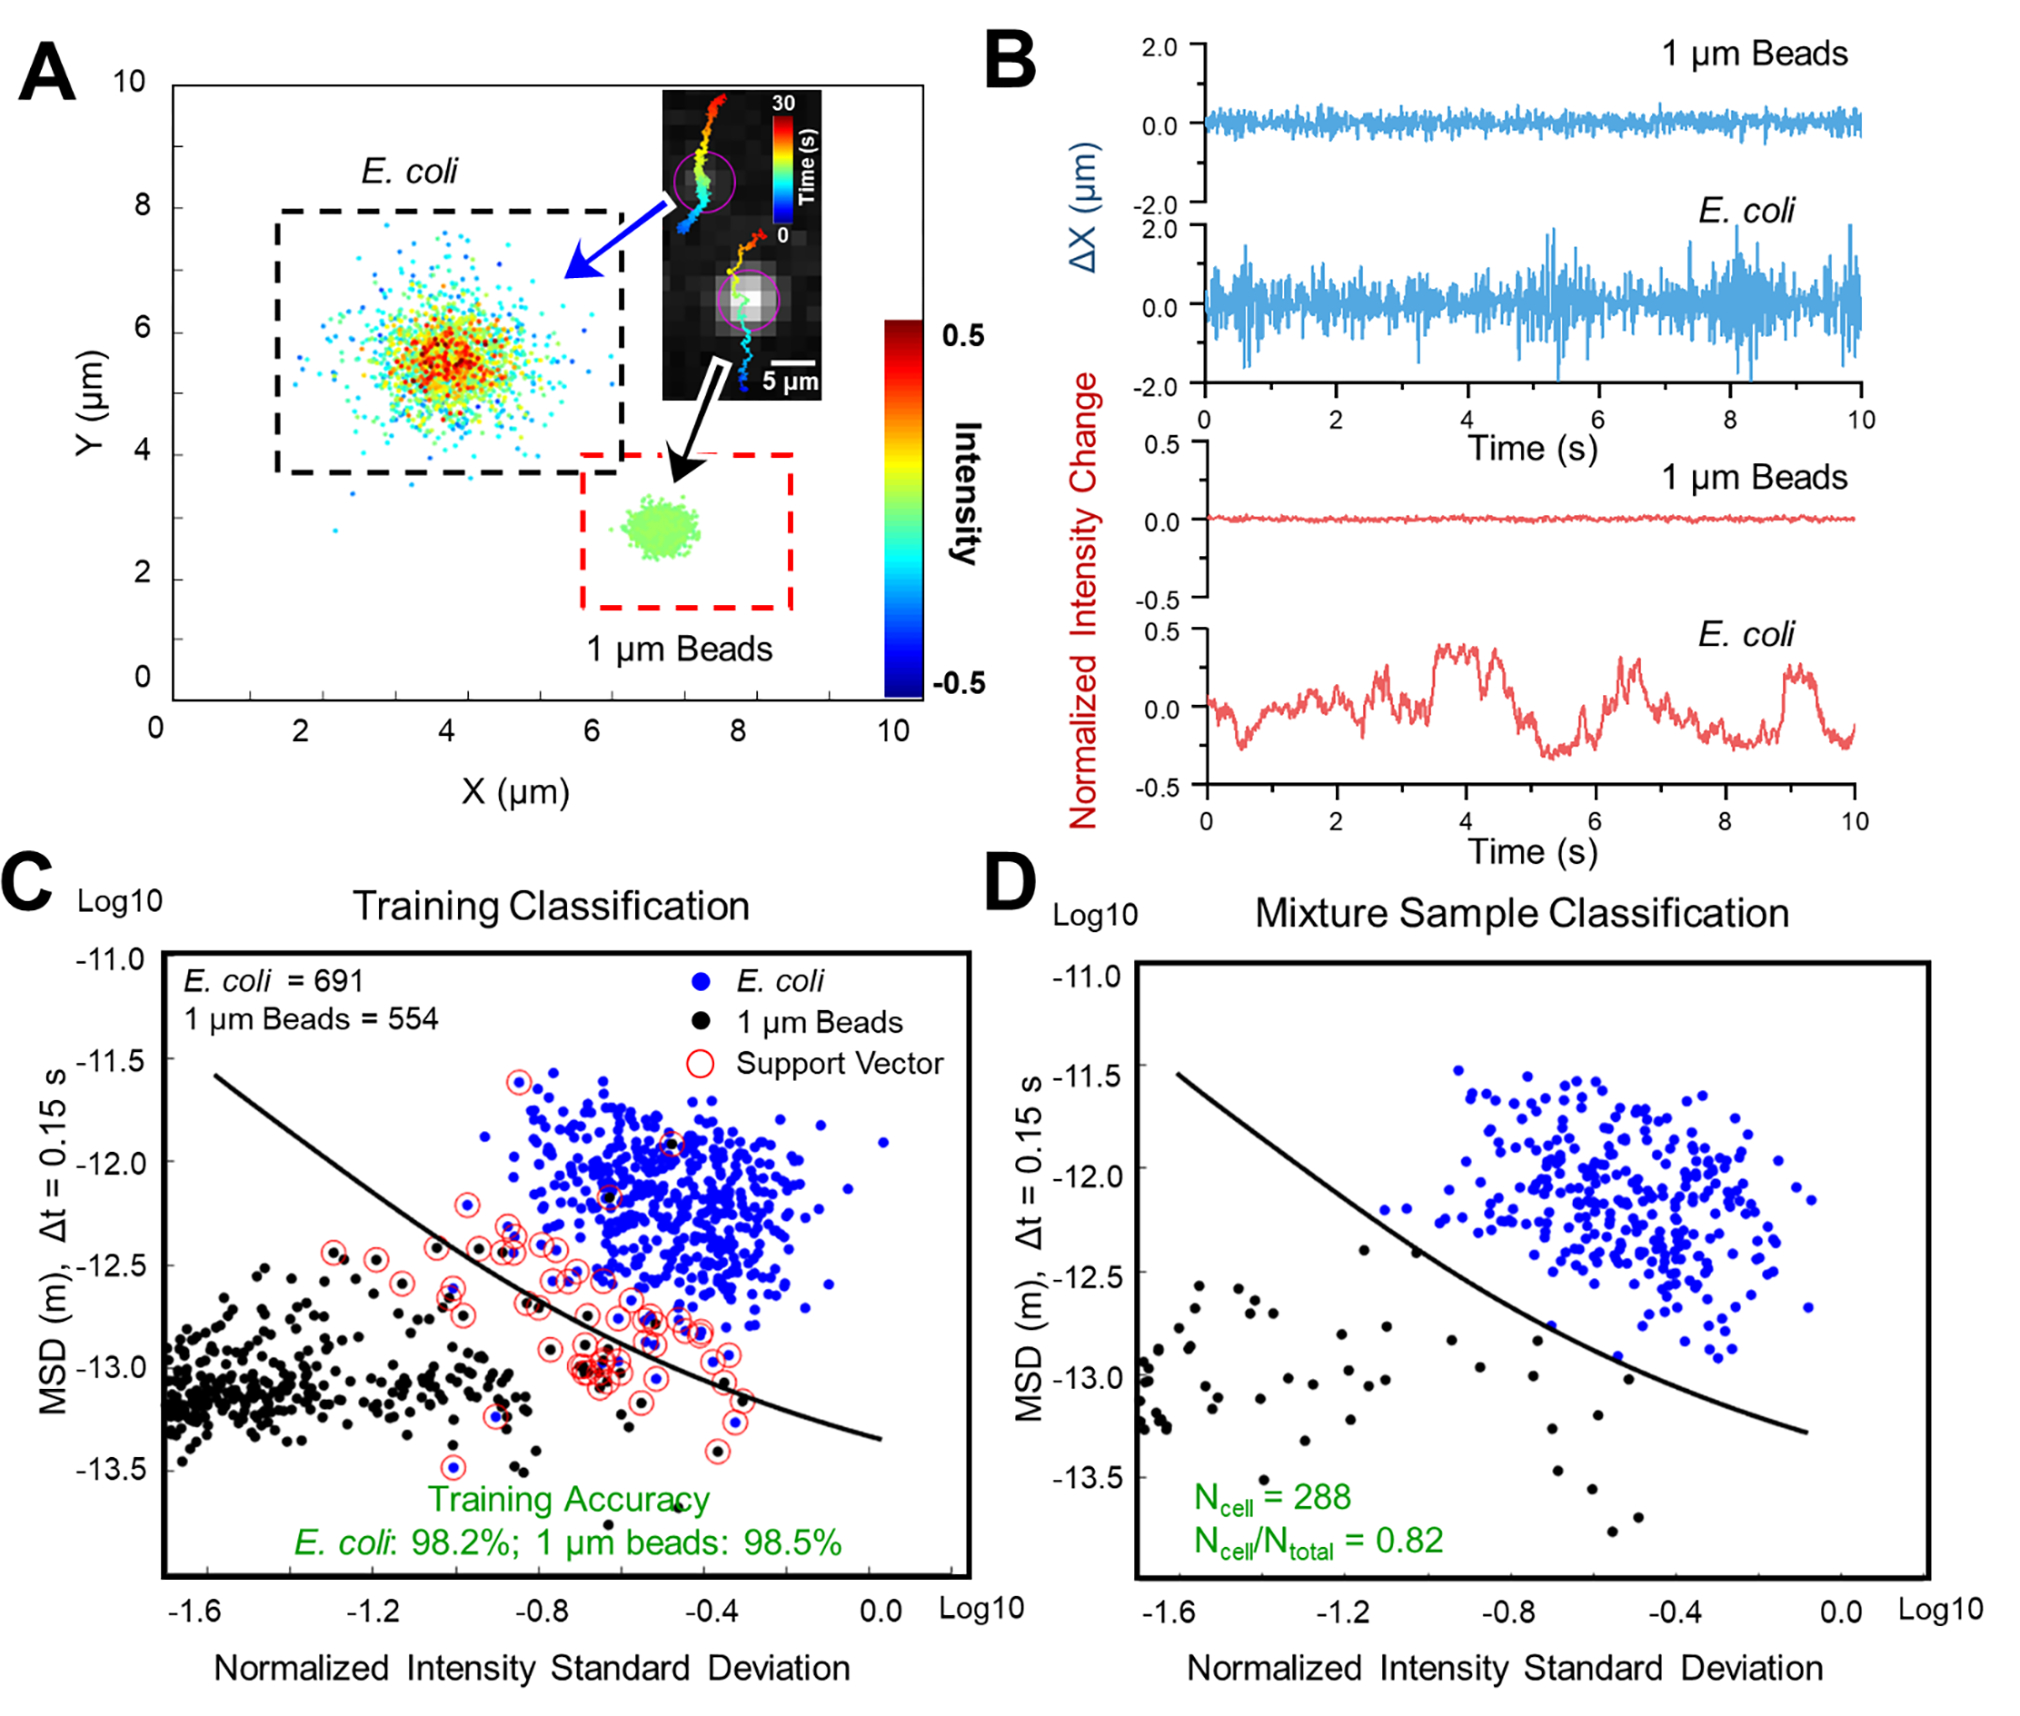
(A) Single cell motion and intensity mapping for E. coli and 1 μm polystyrene beads. (B) Comparison of the corresponding micro motion (top panel) and intensity fluctuation (lower panel) of single E. coli cell and 1 μm polystyrene bead. (C) Training results with machine learning classification (Support Vector Machine, SVM) based on mean squared displacement (MSD) of single cell motion and normalized intensity standard deviation (NISD) of single cell intensity. (D) Classification of a 4:1 mixed sample of E. coli: polystyrene beads with the trained SVM model. Scale bar: 5 μm.