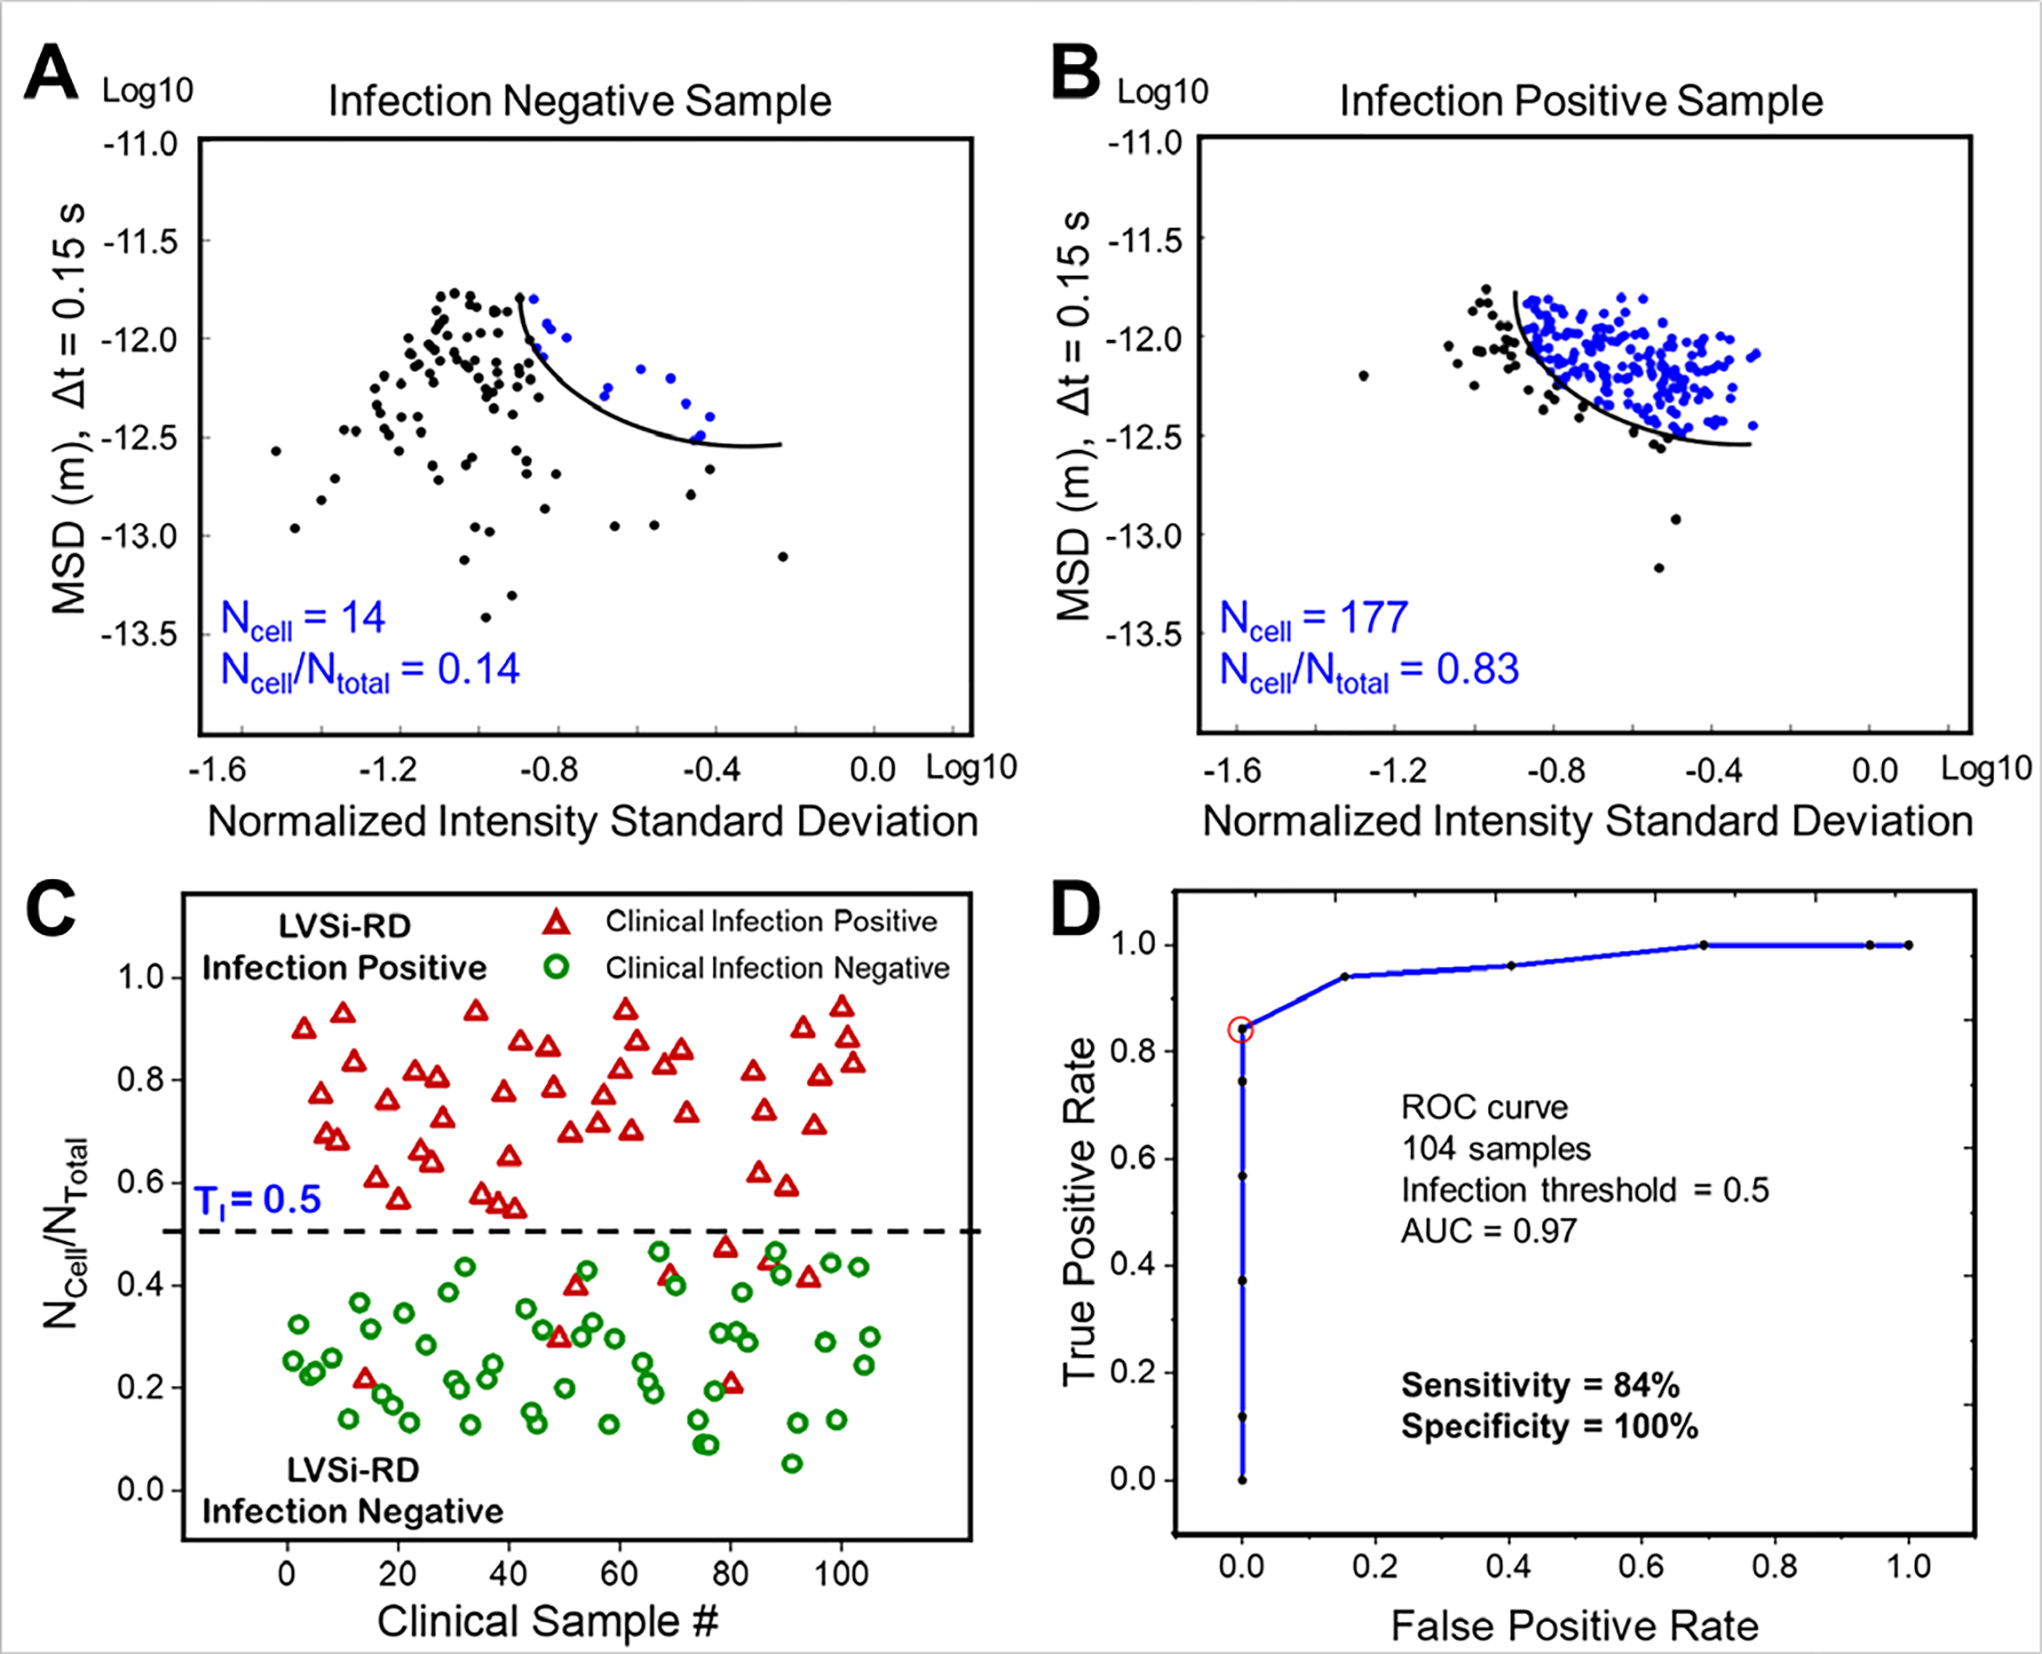
Figure 5. Rapid infection detection with the trained SVM model.

(A) SVM classification result of one representative infection negative sample (Sample #11). (B) SVM classification result of one representative infection positive sample (Sample #12). (C) Comparison of culture-based detection and phenotypic tracking for LVSi-RD of UTIs. TI indicates the determined infection threshold. (D) The ROC curve for UTI diagnosis evaluation from LVSi-RD. At the threshold of 0.5, the sensitivity and specificity were 84% and 100%, respectively.
