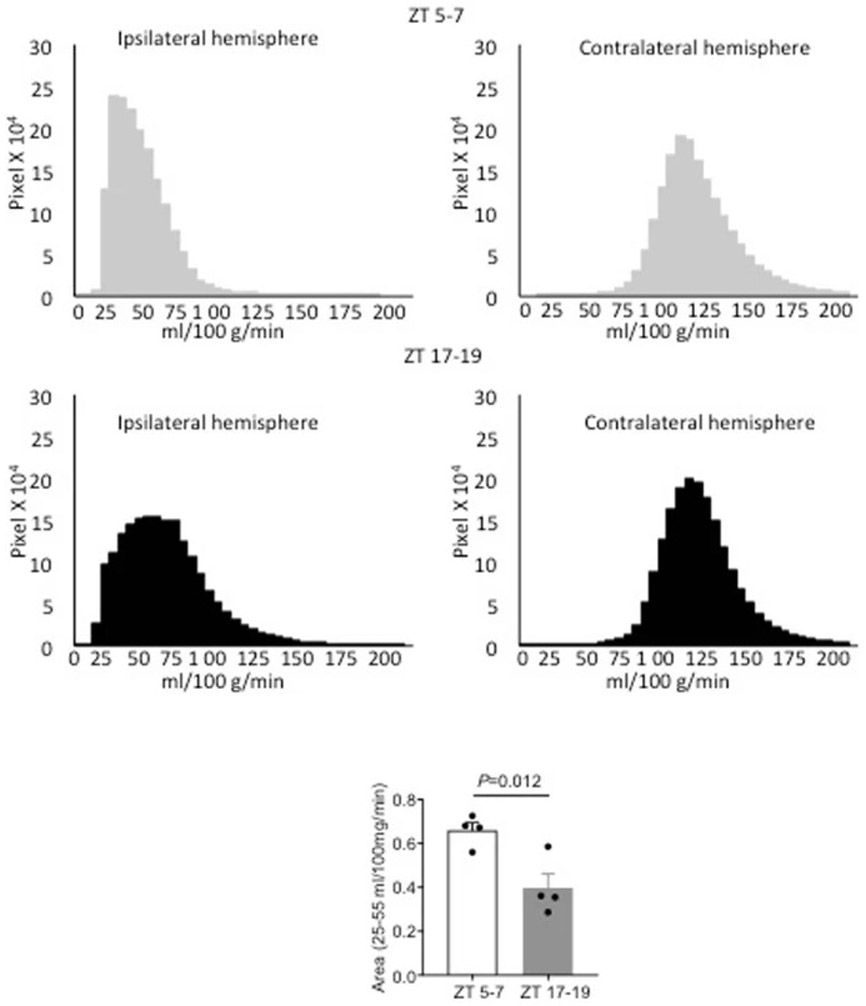
Extended Data 6:

Quantitation of blood flow was checked by calculating speckle imaging data in terms of absolute blood flow (mL/100g/min). Blood flow histograms show the presence of cerebral ischemia in the ipsilateral hemispheres (top panel). Thresholded areas between 25-55 mL/100g/min (see Methods) were significantly smaller in ZT17-19 versus ZT5-7 C57BL6 male mice (n=4 per group, comparisons via 2-tailed t test).
