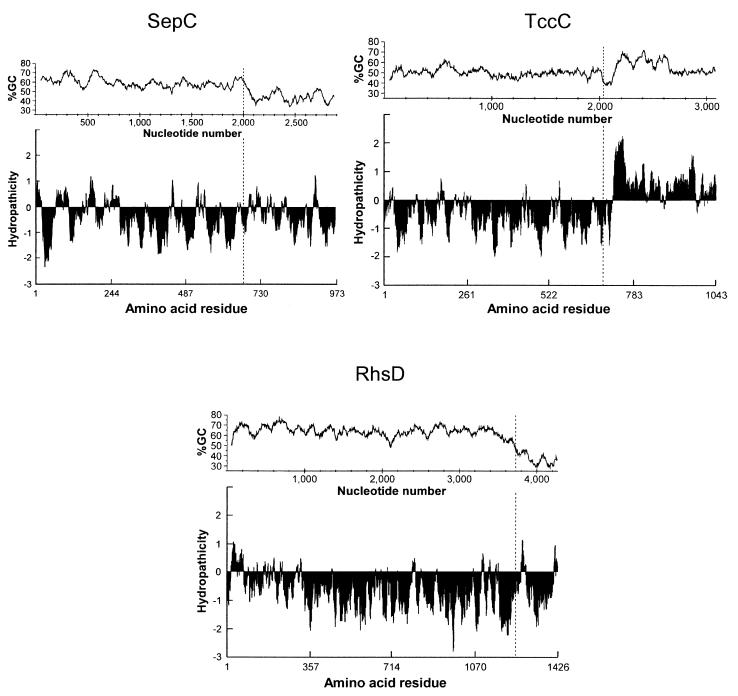
FIG. 5.
GC content (window size, 100; window position shift, 3) and hydropathicity plots of SepC, TccC, and RhsD (scanning window of 17 amino acid residues). Each vertical dashed bar denotes the position of the conserved glycine residue which characterizes the junction between the conserved carboxyl end of the Rhs core and the variable carboxyl terminus.

